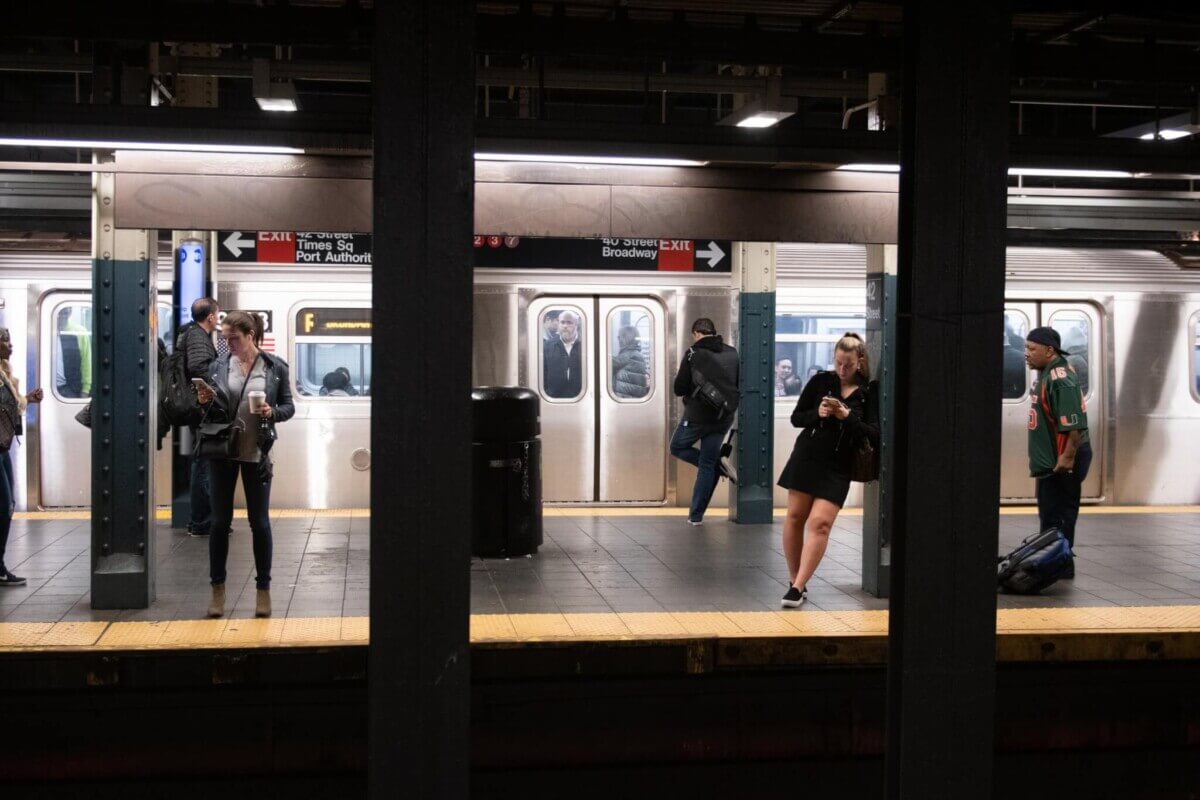
(Credit: Wynand van Poortvliet via Unsplash)
New York Has The Hottest Subway Complaints. London Has The Steepest Rise.
In A Nutshell
- Researchers analyzed over 85,000 social media posts from Boston, London, and New York and found subway heat complaints have risen steadily since 2010.
- New York generates the most heat complaints of the three cities, while London’s system shows the steepest spike in complaints per degree of outdoor temperature rise.
- Underground spaces trap heat more intensely than the surface, and long-term temperature monitoring in most subway systems is virtually nonexistent.
- Researchers say addressing underground heat must become standard practice for transit operators and city planners as climate change intensifies.
Stepping onto a New York City subway platform in July feels less like waiting for a train and more like walking into a sauna with a MetroCard, and new research out of Northwestern University confirms that feeling is well-founded. Analyzing more than 85,000 crowdsourced posts from commuters in Boston, London, and New York, scientists published their findings in Nature Cities.
They found that heat complaints in underground metro systems have climbed steadily since 2010, that New York’s subway generates the most heat complaints of the three cities studied, and that complaints increase as outdoor temperatures rise.
Underground spaces trap warmth in ways the surface never does. Subway tunnels hold heat because soil and rock block the airflow that would otherwise carry it away. London’s Underground hit 47°C (roughly 116°F) inside its tunnels in 2008, a figure that exceeded the highest surface temperature ever recorded in the city, which reached 40.2°C (104°F) in 2022. As surface heat rises, underground systems can get hotter too.
The consequences go beyond a sweaty commute. Prior research has linked prolonged heat exposure to aggressive behavior, and the infrastructure itself suffers too. High heat warps rails, speeds up the deterioration of mechanical components, and can destabilize building foundations above buried tunnel networks. For the many riders who pass through these systems every year, it is a public health problem that has gone largely untracked, because the agencies responsible have almost no publicly available long-term data on underground temperatures.
How 85,000 Social Media Posts Exposed the Subway Heat Problem
Rather than rely on traditional surveys, Northwestern researchers Giorgia Chinazzo and Alessandro F. Rotta Loria went straight to social media. The study describes mining public posts from X (formerly Twitter) and Google Maps published between 2008 and 2024, using a technique called Natural Language Processing to automatically identify heat-related complaints. The result was a dataset far larger and longer-running than anything the field had produced before.
Of 85,039 total posts collected, 22,233 contained genuine thermal complaints. Posts were flagged using heat-related keywords such as “hot,” “boiling,” “scorching,” “tropical,” and “blistering,” then filtered to remove unrelated uses like “hot dog” or “warm smile.” More than 1,000 posts were manually reviewed to keep that filtering sharp. Because long-term underground temperature records do not exist for most cities, daily outdoor air temperatures from NOAA served as the study’s proxy for subsurface conditions, given that surface and subsurface temperatures are closely linked.
Complaint volumes grew across all three systems from 2010 through 2024, with a predictable dip during the COVID-19 pandemic when ridership collapsed, followed by a steady climb back. Both London and New York draw far more riders than Boston, and their overall user bases are roughly comparable in size. Yet New York generated significantly more annual heat complaints than London, a pattern the data suggest points to less comfortable thermal conditions in the American city, a conclusion consistent with published platform temperature reports.

New York Leads in Complaint Volume, But London Is Most Sensitive to Each Degree
Summer was the peak season for complaints across all three cities, with July consistently the worst month. Spikes in 2018 and 2019 corresponded with severe heatwaves in all three cities. Within a given day, London riders complained most in the late afternoon, while Boston and New York commuters showed two peaks: around noon and again near 9 p.m., timing consistent with workers leaving for lunch or heading home at the end of the day. Weekends brought fewer complaints everywhere, which the researchers suggest reflects more relaxed clothing and a higher tolerance for discomfort on days off rather than any actual improvement in conditions.
The most telling numbers involve how complaint rates shifted with temperature. For every 1°C increase in outdoor temperature above 10°C (50°F), thermal complaints rose by 10% in Boston, 12% in New York, and 27% in London. New York leads in sheer complaint volume, but London’s system is far more reactive to each additional degree of heat. The researchers do not offer a definitive explanation for London’s steeper sensitivity in the paper, though the finding is consistent with what is broadly known about the age and design of that city’s oldest Underground lines.
Gender differences showed up in the data too, though inconsistently. In London, a higher proportion of complaints came from users identified as male; in New York, the reverse held. No significant gender difference appeared in Boston. Because the dataset captured only complaint-related posts rather than a full cross-section of riders, these patterns reflect who was complaining publicly, not necessarily who was suffering most.
Millions of Commuters Are Absorbing Heat That Nobody Is Officially Measuring
What the dataset suggests, across more than a decade and three major transit systems, is that riders are struggling with heat in ways these systems are not well equipped to monitor or address. Social media captured what official monitoring missed: a long accumulation of evidence that urban commuters are dealing with serious heat on their daily rides. As the researchers wrote, “action against this under-explored and under-appreciated phenomenon should become business as usual.”
Outdoor temperatures will keep rising. Heatwaves will keep intensifying. Without better public data on underground conditions and real commitment from transit operators and city planners, millions of commuters will keep absorbing heat that nobody is officially measuring, one sweltering platform at a time.
Disclaimer: This article is based on a peer-reviewed study published in Nature Cities. The findings reflect patterns observed in crowdsourced social media data from Boston, London, and New York and may not apply to other cities or transit systems. Outdoor air temperatures were used as a proxy for underground conditions due to the scarcity of long-term subsurface temperature records.
Paper Notes
Limitations
Several factors limit the scope of these findings. Social media data skews toward younger, English-speaking users who are comfortable posting publicly, meaning older adults, non-English speakers, and people without smartphones are likely underrepresented. Gender analysis relied on a historical database of English first names and may misclassify accounts using pseudonyms or non-standard identifiers. Because long-term underground temperature records are unavailable for all three cities, outdoor air temperatures were used as a proxy, which may not fully reflect conditions on specific platforms or in particular tunnels. COVID-19 ridership disruptions in 2020 and 2021 complicate year-over-year comparisons during that window.
Funding and Disclosures
This research was supported by the United States National Science Foundation under Grant No. 2046586. Dylan Wu from Damous assisted with data collection. No competing interests were declared.
Publication Details
“Thermal Discomfort in Urban Underground Metro Systems” was authored by Giorgia Chinazzo and Alessandro F. Rotta Loria, both of the Department of Civil and Environmental Engineering at Northwestern University, Evanston, Illinois. Chinazzo is affiliated with the Controlled, Adaptive and Responsive Environments Laboratory (CARE); Rotta Loria leads the Subsurface Opportunities and Innovations Laboratory (SOIL). Published in Nature Cities. DOI: 10.1038/s44284-026-00404-4. The dataset and supporting code are publicly archived on Zenodo at https://doi.org/10.5281/zenodo.17718525.


