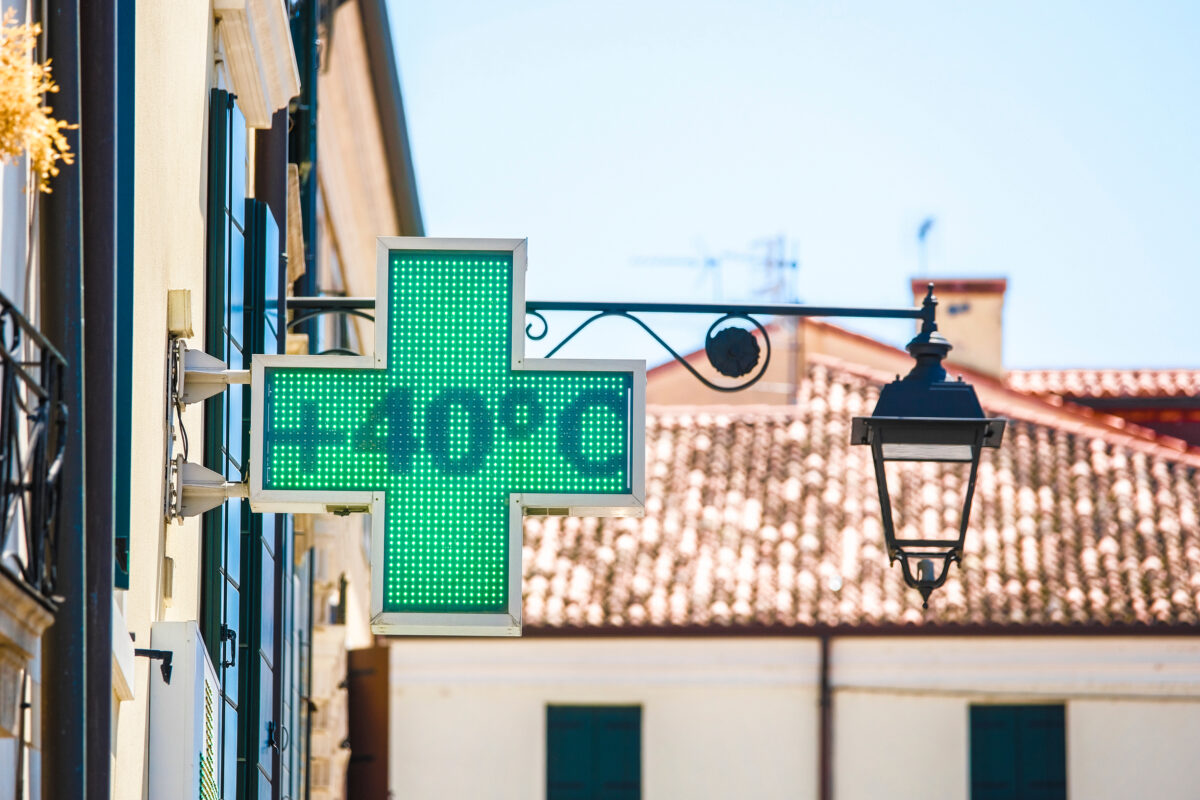
(Credit: Vereshchagin Dmitry on Shutterstock)
In A Nutshell
- A new AI-powered climate model shows that global emissions released since 2015 made Europe’s deadly June 2025 heatwave about 0.6 degrees Fahrenheit hotter.
- Those same post-2015 emissions raised regional temperatures during Europe’s hottest week of the year, and increased the number of extreme-heat days, for every year since 2021.
- Just 12.1 percent of all fossil-fuel carbon dioxide emitted since 1850 was enough on its own to measurably intensify the 2025 heatwave.
- The findings show that climate pledges have not stopped the damage: emissions released even after the Paris Agreement are still fueling deadly heat in Europe.
Europe’s brutal June 2025 heatwave, which killed thousands, would have been about 0.6 degrees Fahrenheit cooler if the same weather pattern had occurred with cumulative emissions held at 2015 levels. That’s the price of just one decade of emissions released after world leaders signed the Paris Agreement and promised to cut back.
Scientists built an artificial intelligence tool to trace how much of that heatwave, and others like it, can be pinned on greenhouse gas emissions released specifically since 2015. Their answer is unsettling: global emissions from just the last decade made Europe’s summer temperature extremes measurably hotter, even though that period was supposed to mark the start of the world cutting back on fossil fuels.
Despite years of pledges to cut carbon pollution, global emissions have kept climbing. This shows that even a small slice of humanity’s total carbon output, the part released after a major climate treaty was already in place, left a mark on real, deadly weather.
New AI Tool Isolates One Decade’s Effect on Europe’s Heat
Figuring out exactly how much a small slice of emissions, rather than all the pollution humans have ever released, changes a single weather event is hard. Normal year-to-year weather swings are so large that they can drown out the signal from a decade’s worth of extra carbon dioxide. That’s a problem for anyone trying to answer a practical question: did the emissions released after a specific climate agreement make a specific disaster worse?
To tackle this, a team led by Jared Trok at Stanford built a diffusion model, the same technology behind AI image generators, according to a study published in the journal Geophysical Research Letters. Instead of generating pictures, the model generated realistic daily temperature patterns over Europe based on weather conditions and the total fossil fuel carbon dioxide released up to that point.
Training data came from 10 global climate models, covering past conditions and a range of future emissions paths, so the tool could learn how temperatures respond to different emissions trajectories. Researchers then fed the model real-world weather data from 1979 through 2025, drawn from a record called ERA5, letting the AI predict what temperatures would have looked like under the same weather setup but with less accumulated pollution, such as the amount that existed in 2015.
Comparing predicted temperatures at today’s emissions levels against those at 2015 levels, for the same weather pattern, let the team isolate the effect of one decade of additional pollution. They ran dozens of predictions per day and emissions level to build uncertainty ranges, rather than relying on a single guess.

Post-2015 Emissions Added Six Tenths of a Degree to Europe’s Hottest Weeks
Before trusting the model on individual disasters, researchers confirmed it reproduced known long-term warming trends and patterns across that same historical record.
With that confirmed, the team turned to Europe’s hottest week of each year from 2016 to 2025, finding more than 95 percent probability that emissions since 2015 increased regional average temperatures during that week for every year from 2021 through 2025. In southern and eastern Europe, the added heat topped six tenths of a degree Fahrenheit.
Extreme heat frequency showed the same pattern. Post-2015 emissions increased the number of days crossing a high heat threshold for every year from 2022 through 2025, with more than 95 percent probability. Under the same weather patterns, parts of the Mediterranean would have seen more than four fewer extreme-heat days a year without those emissions.
Post-2015 Emissions Intensified the 2025 Heatwave by Up to a Degree
Researchers then applied the tool to one specific event: Europe’s early-summer heatwave from June 24 to July 3, 2025, tied to widespread damage and thousands of heat-related deaths, many of which separate research has linked to warming since the pre-industrial era. The model’s predictions closely matched the actual observed temperature pattern.
Running that same comparison on this heatwave, researchers found that emissions since 2015 intensified it by roughly half a degree to nine tenths of a degree Fahrenheit depending on location, hitting the Mediterranean hardest. They calculated more than 99 percent probability that post-2015 emissions raised regional temperatures during the event, landing on a typical estimate of 0.6 degrees Fahrenheit of added heat from that single decade.
Pushing further, the team asked how small a share of cumulative global fossil-fuel carbon dioxide emissions since 1850 would still produce a clear effect on this heatwave. Just 12.1 percent was the smallest share for which researchers estimated more than 95 percent probability that emissions intensified the event.

A Single Decade of Pollution Left a Measurable Mark on Europe
None of this excuses emissions from before 2015. But the study’s authors argue it matters just as much: a narrow window of continued pollution, released even as the world publicly pledged to cut back, still left a measurable mark on a modern, deadly heatwave. Climate pledges don’t pause the damage clock, and every additional year of rising emissions keeps adding fuel to the kind of heatwaves already killing people across Europe, no matter how ambitious the promises made along the way.
Disclaimer: This article is based on findings from a peer-reviewed study and is intended for general informational purposes. It is not scientific, medical, or policy advice. The estimates described reflect one research team’s modeling approach and carry inherent uncertainty, as detailed in the Paper Notes below; future research may refine these findings.
Paper Notes
Limitations
The researchers note that their results are sensitive to the specific timescale and region being examined, since longer events covering larger areas produce a clearer signal than short, localized ones. While they found strong evidence of warming at the regional scale (spanning roughly 2,500 kilometers) during the 2025 heatwave, that confidence dropped sharply at the scale of individual local areas (roughly 250 kilometers), where only a few locations crossed the 95 percent probability threshold. The team’s emissions data also excludes carbon dioxide from land-use changes and non-carbon-dioxide pollutants like aerosols, which other research suggests may be important drivers of Europe’s recent temperature trends. The authors ran additional tests suggesting their main findings hold up even when accounting for other greenhouse gases, but they caution that extending this approach to other kinds of extreme weather, such as heavy rainfall, or other regions would likely require additional adjustments and more thorough evaluation.
Funding and Disclosures
The authors state they have no conflicts of interest relevant to the study. The work was funded by Stanford University and the National Science Foundation, and computing resources were provided by the Stanford Doerr School of Sustainability Center for Computation.
Publication Details
The study, titled “Global Emissions Since the Paris Agreement Have Intensified Europe’s Recent Heatwaves,” was published in Geophysical Research Letters (Volume 53, 2026, e2026GL125079). The authors are Jared T. Trok, Elizabeth A. Barnes, Emily M. Gordon, Frances V. Davenport, and Noah S. Diffenbaugh, affiliated with Stanford University’s Doerr School of Sustainability, Boston University, the University of Auckland, and Colorado State University. The paper is available at DOI: 10.1029/2026GL125079.


