Tax refund: financial life boat or extra spending cash? (Photo by Susan B Sheldon on Shutterstock)
Study Reveals A ‘Friends-and-Neighbors Effect’ That Distorts Tax Preferences
In A Nutshell
- Your social circle acts like a filter, hiding how unequal society really is.
- When people mostly see others like themselves, they vote for lower taxes, even when it hurts them.
- Segregation keeps the poor poorest yet most satisfied, while seeing the rich pushes the poor to demand more.
- Making extreme wealth more visible boosts support for redistribution but also increases conflict.
Most people think the psychology of taxes is fairly straightforward and almost always tied to one’s personal bank account. Interestingly, researchers report something much more nuanced is at play. It isn’t so much about how much money someone has, but who they see every day.
Published in PNAS Nexus, the research uncovered that for most people, their social circles hide the extent of societal inequality so well that they do not see the true state of wealth distribution. This often leads to tax decisions that nonsensically go against one’s own financial interests, as well as society’s best interests as a whole. Even in an idealized direct democracy, redistribution can fail to close the gap.
Researchers from the London School of Economics and the Santa Fe Institute ran an experiment with 1,440 Americans who voted on tax rates in artificial societies. Crucially, they controlled who could see whose wealth. The structure of social networks created blind spots that sabotaged rational decision-making, even when voters would have benefited from redistribution.
“If people do not observe inequality on a daily basis, they underestimate the severity of the problem and their own standing, and consequently do not take the due political stance and action,” the researchers write.
How Social Circles Shape Tax Votes
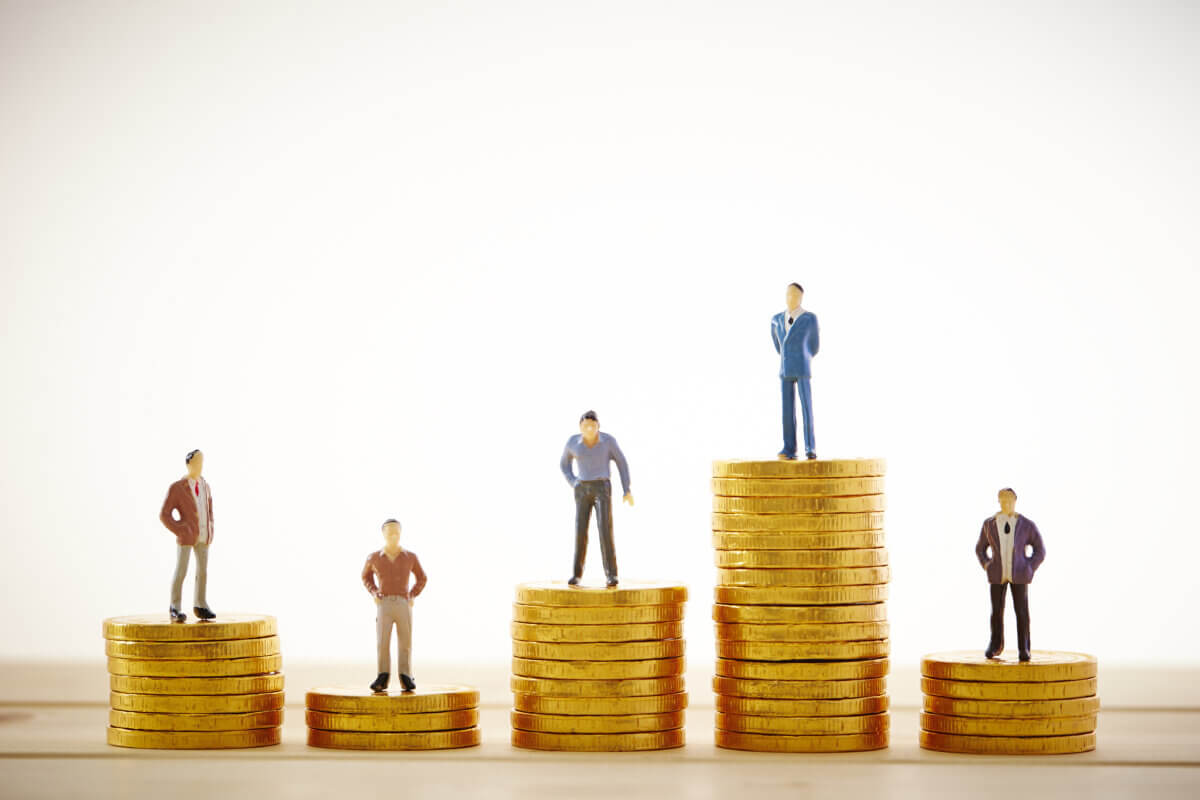
The experiment randomly assigned participants to be either rich (starting with about 200 points) or poor (starting with about 20 points). Groups of 24 people then voted on a tax rate between 0% and 100%. The tax revenue would be collected and redistributed equally to everyone in the group.
Each person could only see the wealth of eight others in their group—and the researchers carefully controlled which eight. Some people saw mostly others with similar wealth. Some saw a representative sample. Others saw mostly rich people, or mostly poor people, or were completely segregated by wealth.
Networks that mirror real life — where people tend to befriend others with similar incomes — produced the lowest tax rates. In segregated networks, where the rich only saw other rich people and the poor only saw other poor people, taxes dropped even lower.
Both groups agreed on low taxes for different reasons. Poor participants thought there wasn’t much money to redistribute because everyone they saw was poor like them. Rich participants figured few people needed help because everyone they saw was doing fine. Both made rational calculations based on systematically biased information.
Why Democratic Voting Doesn’t Fix Inequality
This finding helps solve a puzzle that has frustrated economists for decades. In theory, democratic countries with high inequality should naturally vote for more redistribution. The median voter (the person whose preferences determine the outcome) typically has less than the average wealth. They should always vote to tax the rich and share the proceeds.
Yet inequality has been rising in many democracies for 40 years. Income and wealth disparities in the United States, United Kingdom, Canada, and Australia have grown larger, not smaller, despite regular elections.
Political scientists usually blame broken institutions: corrupt elites, wealthy lobbyists, voter suppression, bundled party platforms. All of these factors matter. But the new research points to something more basic: people can’t demand redistribution they don’t know they need.
The experiment tested this directly by creating a stripped-down, idealized democracy inside the lab. No lobbyists. No political parties. No corrupt officials. Just pure majority rule, where the median vote wins and gets immediately implemented. Even under these controlled conditions, certain network structures—particularly those where people mostly see similar others—led to persistently low redistribution and high inequality.
Segregation Keeps the Poor Content With Less
Perhaps most troubling, segregation by wealth didn’t just reduce redistribution. It also kept people satisfied with unfair outcomes.
At the end of the experiment, participants rated their satisfaction with their final score and whether they thought the distribution in their group was fair. Poor people in segregated networks—who ended up with the least money—reported being the most satisfied. Poor people who saw many wealthy neighbors ended up with more money but felt worse about it.
“Segregation keeps the poor poorest but satisfied, while observing the rich makes them dissatisfied despite becoming better off,” the researchers note.
This aligns with decades of research showing that people judge their economic situation relative to those around them, not in absolute terms. A person earning $30,000 surrounded by others making the same feels richer than someone earning $40,000 surrounded by millionaires.
The political consequences are serious. If social networks keep poor people content with less, they won’t agitate for change. They won’t protest. They won’t vote for redistribution. They’ll accept their position because everyone they know occupies a similar one.
The Tradeoff Between Equality and Harmony
The experiment did find one network structure that produced high redistribution: when everyone, rich and poor alike, could see mostly wealthy people. In these networks, poor participants voted for tax rates approaching 100%, and their high numbers carried the vote.
But this came at a steep cost. These networks showed the highest levels of disagreement—the poor and rich voted for wildly different tax rates. Poor participants in these networks also reported feeling the least satisfied and judged the outcomes as most unfair, despite ending up relatively better off financially.
Over the three rounds of voting, this division intensified. Poor people who saw wealthy neighbors radicalized, with many eventually voting for 100% taxation. The rich never budged from their low-tax preferences. In contrast, when people saw mostly similar others, votes stayed moderate and agreement remained high—but so did inequality.
This exposes an uncomfortable choice at the heart of democratic redistribution: the social structures that make people demand more equality also make them more divided and dissatisfied. The structures that create harmony keep inequality entrenched.

Why Most People Underestimate Inequality
The experimental findings match survey research showing that people habitually underestimate inequality in their society. Americans tend to think wealth is distributed far more evenly than it actually is. They also misjudge their own position, with wealthy people often thinking they’re middle class.
The primary reason? Social circles aren’t random samples of society. They’re clustered by income, education, geography, and profession. A software engineer in San Francisco knows other software engineers making similar salaries. A retail worker in rural Ohio knows other retail and service workers. Neither group encounters the full spectrum of wealth distribution in their daily lives.
The mathematical properties of income distributions make this worse. Because wealth follows a right-skewed pattern, that is, most people have little while a few people have enormous amounts, the typical person is poorer than average. But in most social networks, people encounter others slightly richer than themselves, creating an upward bias.
The researchers’ computational model shows that even small amounts of clustering by similar income dramatically reduces perceived inequality. When the rich see other rich people and the poor see other poor people, both groups underestimate the gaps between them.
Taxes and Cultural Beliefs
The experiment also showed that voting on redistribution isn’t purely about self-interest. Participants clearly cared about more than just maximizing their own score. In post-experiment surveys, many mentioned concerns about equality, fairness, and balance, not just personal gain.
Many participants brought strong preexisting beliefs about taxation to the experiment. Most votes gravitated toward 20-25%, or roughly the effective tax rate many Americans actually pay, regardless of whether higher taxes would benefit them in the game. Political orientation mattered: conservatives voted for lower taxes, while those who perceived themselves as lower income voted for higher taxes.
Women assigned to be poor voted for lower taxes than men in identical situations, contradicting survey research showing women generally support higher redistribution. The researchers suggest women may have had more difficulty understanding the experimental instructions or felt more pressure to conform to prevailing anti-tax norms.
What This Means for Policy
The research carries clear recommendations. If political leaders want to build support for redistribution, they should increase the visibility of extreme wealth. News coverage of billionaires, political discourse about wealth concentration, social media discussions of inequality — all of these can counter the blind spots created by segregated social networks.
But this strategy risks increasing division and conflict. When poor people see the wealth they’re excluded from, they demand more; but they also grow angrier and less satisfied, even when redistribution succeeds.
There may be no perfect solution. Social networks appear to create an unavoidable choice: either maintain harmony through separation while inequality persists, or increase visibility of disparities while accepting greater division.
The study focused on wealth and redistribution, but the same dynamics likely apply to other forms of inequality. Gender pay gaps, racial wealth disparities, geographic divides — all of these become invisible when people cluster with similar others. And what people can’t see, they can’t fix, even in a functioning democracy.
The researchers acknowledge the experiment used simplified tax rules and artificial groups. Real societies have progressive taxation, complex political systems, concerns about economic efficiency, and cultural factors the experiment couldn’t capture.
Still, the core finding stands. Social structure shapes perception, perception shapes preferences, and preferences determine policy. If the networks people inhabit systematically hide inequality, even ideal democracies may struggle to address it.
The next time someone votes for a tax policy that seems to contradict their economic interests, the answer may not be manipulation or ignorance. They may simply be voting based on the world they see—and that world, shaped by who they encounter daily, looks nothing like the world that actually exists.
Paper Notes
Study Limitations
The experiment used a simplified model of taxation and redistribution that differs from real-world systems in several ways. Participants interacted in artificial groups of 24 people over just three voting rounds in an asynchronous online environment, which doesn’t capture the complexity of ongoing political processes or face-to-face deliberation. The study employed a flat tax rate rather than progressive taxation, and benefits were distributed equally rather than through targeted programs or services. The researchers also used fixed network structures rather than allowing social connections to form naturally or change over time. Participants came from the United States and may have brought culture-specific beliefs about taxation that wouldn’t appear in other populations. The study couldn’t account for factors like economic productivity concerns, administrative costs, tax avoidance behaviors, or the full range of motivations that drive real-world tax policy debates. The model assumed people don’t correct for sampling bias when estimating population-level inequality from their social circles, though some research suggests people do partially adjust for this. Finally, the utility function used in the computational model relied on parameter estimates from different studies, and the correlation between individual aversion to advantageous versus disadvantageous inequality remains unknown.
Funding and Disclosures
Research for this article was funded by the Santa Fe Institute and the Research Infrastructure and Investment Fund of the London School of Economics’ Department of Methodology. Henrik Olsson and Mirta Galesic also received funding from European Research Council grant number 101140741. The authors declared no competing interests. The study protocol was preregistered and approved by the Research Ethics Review Board of the London School of Economics and Political Science. Informed consent was obtained from all 1,440 participants, who were recruited through Prolific and compensated £1.50 for the first round plus a performance-based bonus averaging £2.17.
Publication Details
Authors: Milena Tsvetkova (Department of Methodology, London School of Economics and Political Science), Henrik Olsson (Santa Fe Institute and Complexity Science Hub, Vienna), and Mirta Galesic (Santa Fe Institute and Complexity Science Hub, Vienna)
Journal: PNAS Nexus, Volume 4, Number 11
Publication Date: November 25, 2025 (advance access) | DOI: 10.1093/pnasnexus/pgaf339 | Study Design: Combined computational modeling and online behavioral experiment with random assignment to experimental conditions | Sample: 1,440 participants from the United States recruited via Prolific, organized into 60 groups of 24 people, with 10 groups per experimental condition | Data Availability: Anonymized experimental data, model code, and analysis scripts are available on Figshare at https://doi.org/10.6084/m9.figshare.28676018.v3


