
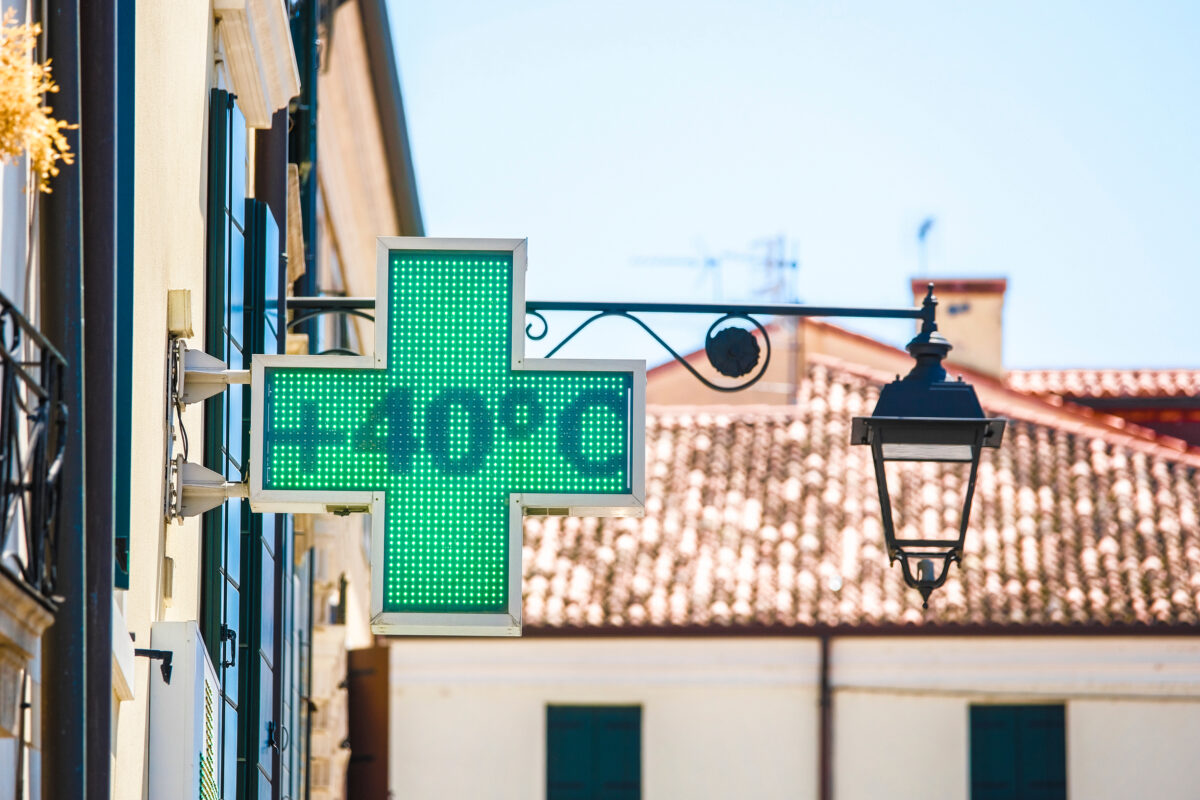
Europe, much like the rest of the world, is getting hotter and hotter on average. (Credit: Shahbaz Hussain Shah on Shutterstock)
In A Nutshell
- If August 2003’s weather returns at 3°C warming, one week could kill 32,000 people across Europe, matching the deadliest weeks of COVID-19.
- Current adaptation measures reduce heat deaths by only 10%, meaning mass mortality remains likely even as regions prepare.
- Climate change already accounts for roughly 72% of deaths during extreme heat events, tripling what the weather alone would cause.
- The deadliest scenario tested, July 1994 weather at high warming levels, barely caused excess deaths when it actually occurred because temperatures were lower then.
If Europe sees another heat wave like the summer of 2003, over 30,000 people could die in the span of a single week. That’s the sobering conclusion drawn from a research project highlighting just how much hotter average temperatures have become since then.
When August 2003’s heat wave baked across Europe, it killed an estimated 70,000 people over the course of the entire summer. Now, research warns that if similar weather patterns return during the world’s recent temperature spike of 1.5°C above pre-industrial levels, a single week could claim 17,800 lives across the continent. At 3°C of warming, that number jumps to 32,000 deaths in seven days, rivaling the deadliest weeks of the COVID-19 pandemic.
Scientists at Stanford University used machine learning to reconstruct five historic European heat waves under different levels of global warming, then calculated the death toll using mortality data from 924 regions across Europe. Their findings, published in Nature Climate Change, show that mass casualty events from extreme heat are not only possible at temperatures the world is approaching but remain plausible at near-future temperatures despite current adaptations to heat.
Historic Heat Waves Get Deadlier With Each Degree of Warming
The research team, led by Christopher Callahan, took weather patterns from five major European heat events between 1994 and 2023 and asked: How deadly would these same meteorological conditions be if they occurred during hotter years?
Using neural networks trained on climate models, the researchers predicted temperatures that would result from historical atmospheric pressure patterns and soil moisture levels at various global temperature increases. They combined these projections with empirical data linking temperature to mortality rates across hundreds of European districts from 2015 to 2019.
August 2003 emerged as the deadliest scenario. At 2°C of global warming, those weather conditions would generate roughly 24,700 excess deaths in one week. At 4°C—a level still possible under gradual decarbonization scenarios—the toll reaches 45,100 deaths.
Other events also showed high death tolls. July 1994 weather patterns, which produced only moderate temperature increases when they actually occurred, would kill around 25,000 people in a week at 3°C of warming. July 2006 conditions would claim 25,600 lives, while the more recent June 2019 and August 2023 patterns would each produce between 18,000 and 21,000 weekly deaths at the same temperature threshold.
Current Adaptation Measures Barely Make a Dent
The most concerning finding involves adaptation. European countries undertook heat action measures following previous extreme events, and the study’s mortality data from 2015-2019 captures these more recent adaptations. The researchers modeled additional future adaptation by assuming regions would continue adjusting as their climates warm.
When they incorporated this assumption, mortality dropped by only 10% on average. For the 2003-type event at 3°C, deaths would decline from 32,000 to about 28,800.
“While mitigating further global warming can reduce heat mortality, mass mortality events remain plausible at near-future temperatures despite current adaptations to heat,”study authors write.
The relationship between temperature and mortality shows why adaptation struggles. Warmer regions have higher temperature thresholds before mortality increases, suggesting successful adaptation. However, once temperatures exceed those thresholds, deaths rise even more steeply than in cooler regions. Extreme heat still kills even where people have adapted to generally hotter conditions.
Heat Events Could Overwhelm Hospitals Like COVID Did
To put these numbers in context, the researchers compared their projections to weekly COVID-19 deaths across the same European regions. During the pandemic’s worst 10% of weeks, between 27,900 and 34,100 confirmed COVID deaths occurred across Europe. A 2003-style heat wave at 3°C would land squarely in that range. At 4°C, the 1994, 2003, and 2006 weather patterns would each exceed even the single deadliest week of COVID-19 in Europe.
The comparison extends beyond raw numbers. Like COVID-19 surges, these heat events would strain hospital capacity and emergency services, but they would arrive with little warning and peak within days rather than weeks. Healthcare systems prepare for average heat impacts but may lack surge capacity for extreme events that compress thousands of deaths into a few days.
Heat mortality doesn’t distribute evenly. Under 1994-like conditions, Germany, Poland, and Eastern Europe see the highest death rates. Under 2023 conditions, Spain, Italy, and the Balkans suffer most. The spatial variation reflects both where temperatures climb highest and regional differences in vulnerability.
Climate Change Already Accounts for Most Heat Deaths
Comparing each event to a baseline without global warming or heat waves reveals climate change’s contribution. For the 2003-type event at 3°C, anthropogenic warming accounts for about 23,000 of the 32,000 peak weekly deaths, or roughly 72%. Without human-caused climate change, the same weather pattern would still produce 9,000 excess deaths, but global warming more than triples the toll.
This attribution holds across the other events as well. At higher temperature increases, 70-80% of heat deaths trace directly to climate change intensifying what the weather pattern would have produced naturally.
The work differs from typical climate impact studies. Rather than projecting how often certain conditions might occur, it asks: What happens if weather patterns that have already produced heat waves return when the world is hotter? This “storyline” approach acknowledges that the short observational record makes it difficult to assess probabilities of the rarest events.
By learning from climate models how atmospheric patterns translate into surface temperatures at different global warming levels, the machine learning system can project realistic scenarios without requiring those exact conditions to appear in lengthy model runs. Each counterfactual event uses meteorological conditions from reanalysis data, ensuring physical consistency.
The mortality calculations use a regression approach that isolates the causal effect of temperature while controlling for seasonal patterns and trends. Because the analysis uses mortality data from 2015-2019, it captures recent adaptation, including changes made after 2003.
The study acknowledges several limitations. It uses all-age mortality rather than age-stratified rates, though the researchers found nearly identical exposure-response functions for people over 65, who dominate heat deaths. Future population aging could increase vulnerability by 1-3%, a small effect relative to the temperature changes examined.
The projections also depend on whether historical weather patterns recur. If those atmospheric configurations never repeat, these events won’t happen. However, the short observational record means even more extreme patterns likely exist that haven’t yet been witnessed.
The study’s most critical insight? Researchers stress the July 1994 patterns, which produced the highest cumulative mortality of any event tested, didn’t cause massive mortality when they actually occurred because global temperatures were lower.
Mass casualty heat events require both physical drivers (high-pressure systems and dry soils) and vulnerable populations. The research combines both elements by using machine learning to project temperature extremes under weather conditions that have actually occurred and empirical data to calculate human health consequences. Such analysis helps health systems prepare for potential surge capacity needs rather than just average impacts.
Disclaimer: This article is for general informational purposes only and does not constitute medical, public health, or professional advice. Readers should consult qualified healthcare professionals and official public health guidance for personal health decisions and emergency preparedness.
Paper Notes
Study Limitations
The analysis uses all-age mortality data rather than age-specific rates to maximize geographic coverage, though sensitivity analyses show similar results for the over-65 population that drives most heat deaths. The projections assume adaptation patterns observed spatially will apply over time, though the relationship between long-term temperature and heat sensitivity could change if factors beyond current observations become relevant. The study examines historical weather patterns, which may or may not recur, though the short observational record suggests more extreme configurations likely exist. The analysis focuses on excess mortality rather than mechanisms like hospital admissions or emergency department visits.
Funding and Disclosures
The research received funding support from Stanford University. The authors declare no competing interests. Christopher Callahan is currently at the Paul H. O’Neill School of Public & Environmental Affairs at Indiana University. Andrew Wilson is at the Frank Batten School of Leadership and Public Policy at the University of Virginia.
Publication Details
Published: November 18, 2025, Nature Climate Change. DOI: 10.1038/s41558-025-02480-1. Authors: Christopher W. Callahan (Indiana University), Jared Trok (Stanford University), Andrew J. Wilson (University of Virginia), Carlos F. Gould (UC San Diego), Sam Heft-Neal (Stanford University), Noah S. Diffenbaugh (Stanford University), Marshall Burke (Stanford University and National Bureau of Economic Research).


