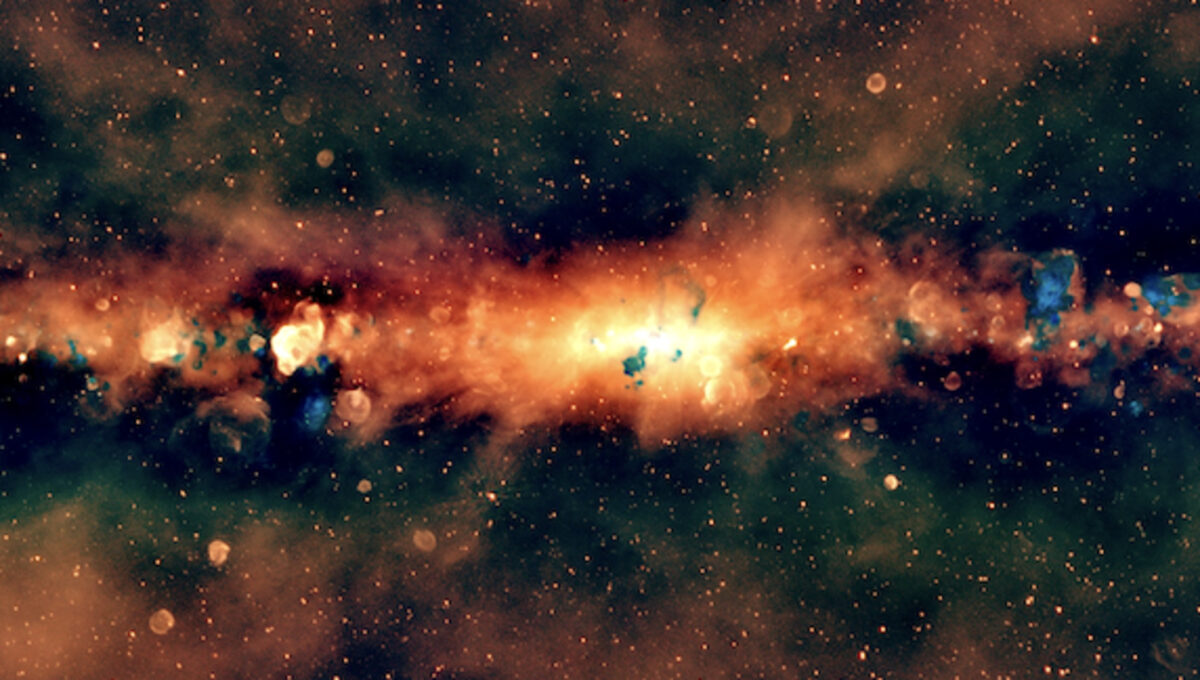
The GLEAM-X view of the Milky Way, as seen from the southern hemisphere, in radio color. (Credit: Silvia Mantovanini & the GLEAM-X Team)
In A Nutshell
- What’s new: Astronomers stitched together thousands of observations from the Murchison Widefield Array to build a single, ultra-sensitive radio “color” mosaic of the Milky Way, spanning 72–231 MHz and covering 95% of the galaxy visible from the southern hemisphere.
- How they did it: They combined the big-picture GLEAM survey (2013–2015) with the high-detail GLEAM-X (post-2018), correcting night-to-night ionospheric distortions with a new imaging method (image-domain gridding) and >1 million supercomputing hours.
- What it reveals: The map separates galactic components by radio color: orange highlights supernova remnants (brighter at lower frequencies), blue marks star-forming regions. This lets scientists pick out different physics at a glance.
- Why it matters: This is the most sensitive, widest-area low-frequency portrait of our galaxy to date, enabling searches for faint, ancient stellar explosions and detailed maps of cosmic rays, dust, and gas, a preview of what SKA-Low will surpass in the coming years.
The Milky Way is a rich and complex environment. We see it as a luminous line stretching across the night sky, composed of innumerable stars. But that’s just the visible light. Observing the sky in other ways, such as through radio waves, provides a much more nuanced scene – full of charged particles and magnetic fields.
For decades, astronomers have used radio telescopes to explore our galaxy. By studying the properties of the objects residing in the Milky Way, we can better understand its evolution and composition.
Our study, published today in Publications of the Astronomical Society of Australia, provides new insights into the structure of our galaxy’s galactic plane.
Observing The Entire Sky
To reveal the radio sky, we used the Murchison Widefield Array, a radio telescope in the Australian outback, composed of 4,096 antennas spread over several square kilometers. The array observes wide regions of the sky at a time, enabling it to rapidly map the galaxy.

Between 2013 and 2015, the array was used to observe the entire southern hemisphere sky for the GaLactic and Extragalactic All-sky MWA (or GLEAM) survey. This survey covered a broad range of radio wave frequencies.
The wide frequency coverage of GLEAM gave astronomers the first “radio color” map of the sky, including the galaxy itself. It revealed the diffuse glow of the galactic disk, as well as thousands of distant galaxies and regions where stars are born and die.
With the upgrade of the array in 2018, we observed the sky with higher resolution and sensitivity, resulting in the GLEAM-eXtended survey (GLEAM-X).
The big difference between the two surveys is that GLEAM could detect the big picture but not the detail, while GLEAM-X saw the detail but not the big picture.
A Beautiful Milky Way Mosaic
To capture both, our team used a new imaging technique called image domain gridding. We combined thousands of GLEAM and GLEAM-X observations to form one huge mosaic of the galaxy.
Because the two surveys observed the sky at different times, it was important to correct for the ionosphere distortions – shifts in radio waves caused by irregularities in Earth’s upper atmosphere. Otherwise, these distortions would shift the position of the sources between observations.
The algorithm applies these corrections, aligning and stacking data from different nights smoothly. This took more than 1 million processing hours on supercomputers at the Pawsey Supercomputing Research Centre in Western Australia.

The result is a new mosaic covering 95% of the Milky Way visible from the southern hemisphere, spanning radio frequencies from 72 to 231 MHz. The big advantage of the broad frequency range is the ability to see different sources with their “radio color” depending on whether the radio waves are produced by cosmic magnetic fields, or by hot gas.
The emission coming from the explosion of dead stars appears in orange. The lower the frequency, the brighter it is. Meanwhile, the regions where stars are born shine in blue.
These colours allow astronomers to pick out the different physical components of the galaxy at a glance.
The new radio portrait of the Milky Way is the most sensitive, widest-area map at these low frequencies to date. It will enable a plethora of galactic science, from discovering and studying faint and old remnants of star explosions to mapping the energetic cosmic rays and the dust and grains that dominate the medium within the stars.
The power of this image will not be surpassed until the new SKA-Low telescope is complete and operational, eventually being thousands of times more sensitive and with higher resolution than its predecessor, the Murchison Widefield Array.
This upgrade is still a few years away. For now, this new image stands as an inspiring preview of the wonders the full SKA-Low will one day reveal.
Silvia Mantovanini, PhD Candidate, Astronomy, Curtin University and Natasha Hurley-Walker, Radio Astronomer, Curtin University
This article is republished from The Conversation under a Creative Commons license. Read the original article.


