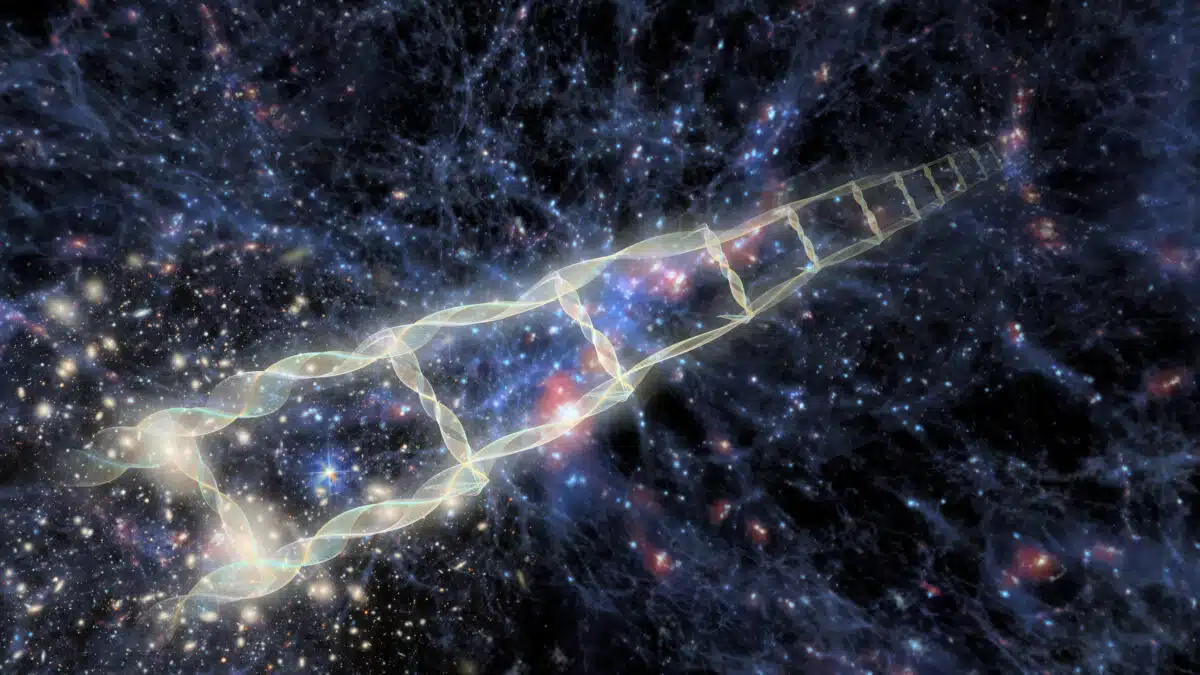
Credit: CTIO/NOIRLab/DOE/NSF/AURA/J. Pollard Image Processing: D. de Martin & M. Zamani (NSF NOIRLab)
In A Nutshell
- A 37-member international team produced the most precise direct measurement of the Hubble constant ever recorded, with just 1.1 percent uncertainty.
- By linking a dozen different cosmic distance measurement methods into a single “Distance Network,” they confirmed the universe is currently expanding at about 73.5 kilometers per second per 3.26 million light-years.
- That rate conflicts with what the Big Bang’s ancient afterglow predicts by more than seven times the margin of error, a gap that makes a simple measurement mistake increasingly implausible.
- Resolving the discrepancy will likely require either finding coordinated hidden errors across multiple independent methods worldwide or revising the standard model of cosmology itself.
Something doesn’t add up about the universe. For years, scientists have been getting two different answers to the same basic question: How fast is the universe expanding? One answer comes from studying the ancient light left over from the Big Bang. The other comes from measuring the distances to stars and galaxies in our cosmic neighborhood. Those two numbers don’t match. And now, after the most careful local measurement ever attempted, the gap between them has only grown harder to explain away.
A team of 37 researchers spanning institutions across four continents, calling themselves the H0DN Collaboration (short for “Local Distance Network”), has produced what may be the most airtight measurement yet of the universe’s current expansion rate, a value known as the Hubble constant. They found that for every 3.26 million light-years of distance between two points in space, the gap between them grows by roughly 73.5 kilometers every second. The uncertainty on that number is just about 1.1 percent. That figure clashes sharply with the rate predicted by studying the early universe. The team puts the disagreement at more than seven times the margin of error, a threshold that in physics essentially rules out coincidence.
How Scientists Measure the Expanding Universe
Measuring the expansion rate sounds simple enough: find out how far away distant objects are, measure how fast they’re moving away from us, and do the math. In practice, it’s very hard. No single technique can span the enormous distances involved, so astronomers build what’s called a “distance ladder,” a chain of methods where each one is calibrated by the one before it, stretching from nearby stars to galaxies billions of light-years away.
At the base of the ladder sit objects whose distances can be measured using geometry rather than guesswork. These include a galaxy called NGC 4258, whose distance is known from the motion of gas clouds swirling around its central black hole, tracked with radio telescopes, as well as stars in the Milky Way and two neighboring galaxies measured through the apparent shift of their positions as Earth orbits the Sun.
Those anchors then calibrate pulsating stars called Cepheids, whose brightness cycles directly reveal their true luminosity, allowing astronomers to calculate their distance. Another useful rung comes from old, dying stars in galaxies that reach a remarkably consistent peak brightness before fading. Both, in turn, calibrate Type Ia supernovae, thermonuclear stellar explosions visible across enormous stretches of the universe that can be standardized based on how quickly they brighten and fade.
Mapping the Hubble Constant With a Distance Network
Previous measurements of the Hubble constant typically relied on one particular chain of methods. Well-known projects like SH0ES calibrated Cepheid stars using geometric anchors, then used those Cepheids to calibrate Type Ia supernovae. H0DN did something different, linking nearly every available method together into a “Distance Network” rather than a single ladder.
This network incorporated about a dozen different types of distance measurements, not only Cepheids and the dying-star brightness method but also several other classes of pulsating and giant stars, the surface textures of galaxies, different kinds of stellar explosions, and relationships between how bright spiral galaxies are and how fast they rotate. Data came from both the Hubble Space Telescope and the James Webb Space Telescope, with results published in Astronomy & Astrophysics.
Researchers also accounted for the fact that many of these measurements share common calibration sources and are therefore not fully independent. Ignoring those overlaps would produce artificially confident results, so the collaboration built a mathematical framework that properly weighted each measurement by how much unique information it actually contributed.
Before calculating any results, the team gathered at a workshop in Bern, Switzerland, in March 2025. Through extensive discussion and anonymous voting, roughly 40 attending experts decided which methods were mature enough to form the “baseline” measurement and which would serve as alternatives to test its stability. Voting happened before anyone saw the combined result, a deliberate choice to prevent the outcome from influencing which data got included.
A Hubble Constant Result That Refuses to Budge
That baseline figure proved remarkably stable under pressure. Removing Cepheids from the analysis barely changed the central value. Removing the dying-star brightness method produced the same story. Replacing Type Ia supernovae with galaxy-based distance indicators barely moved the central value at all, though the uncertainty roughly doubled without those powerful supernova measurements. Removing all data from either space telescope, excluding supernovae observed before 1994, and varying assumptions about how the chemical makeup of stars affects brightness all left the conclusion intact.
Using all available methods narrowed the uncertainty to 0.9 percent, the most precise local measurement of cosmic expansion ever reported. According to the paper, a networked approach “is invaluable for enabling further progress in Hubble constant measurements, as it provides the much needed advances in accuracy and precision without overreliance on any single method, sample, or group.”
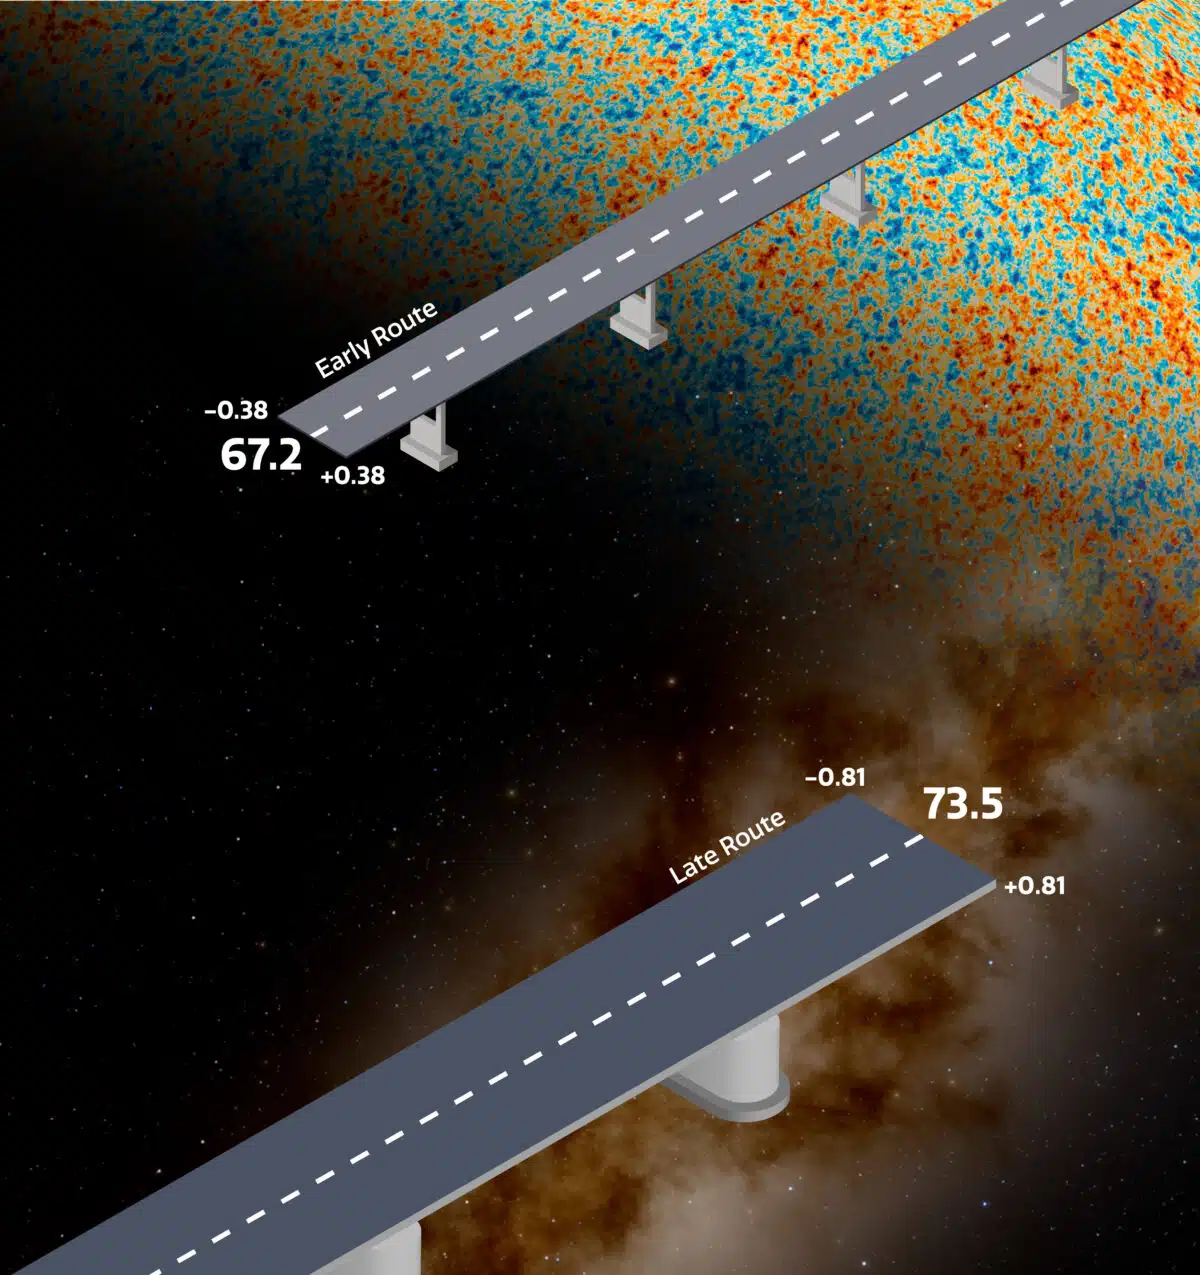
Early-universe observations predict a Hubble constant of about 67 kilometers per second per 3.26 million light-years when combined with the standard model of cosmology, a prediction sitting roughly 9 percent below H0DN’s local measurement. The gap stands at more than seven times the margin of error, and even a separate early-universe measurement using galaxy clustering data and light-element abundances yields a disagreement of about five times the margin of error.
Known as the Hubble tension, this persistent mismatch points to one of two possibilities: either there are undiscovered errors hiding in the measurements, or the standard model of cosmology is incomplete and new physics is needed to explain why the universe is expanding faster today than its early history would predict.
Work by the H0DN Collaboration makes the first possibility increasingly hard to defend. By combining nearly every credible method available, stress-testing the result from every conceivable angle, and doing so through a transparent community process with open-source code and publicly available data, the team has assembled a case that would require coordinated, undetected problems across multiple independent techniques spanning different telescopes, different types of stars, different galaxies, and different research groups around the world. At this point, the universe appears to be telling us something our best theories have yet to explain.
Paper Notes
Limitations
The study acknowledges several important limitations. While the Distance Network framework accounts for known overlaps between methods, combining measurements from different telescopes and instruments involves shared systematic effects, particularly from different calibration starting points, whose full characterization is beyond the scope of this work. The team restricted their analysis to measurements with direct traceability to well-defined sources, generally requiring that linked observations use the same telescope and instrument. Some methods are still maturing, and uncertainties including possible effects from the chemical composition of stellar populations remain active areas of research. One galaxy-rotation dataset showed excess scatter, and the team noted that it roughly doubled the uncertainty when used as a replacement for Type Ia supernovae. The analysis is also limited to relatively nearby cosmic distances where a simple relationship between distance and recession speed holds. Values of the Hubble constant obtained from all variants are highly correlated because they share a large fraction of the underlying data, meaning they are expected to differ from each other by much less than their stated uncertainties.
Funding and Disclosures
The paper is published as an open-access article under the Creative Commons Attribution License (CC BY 4.0). The workshop that initiated this collaboration, “What’s under the H0od?”, was held at the International Space Science Institute (ISSI) in Bern, Switzerland, in March 2025, which provided logistical and organizational support. Additional funding was received from the European Research Council, the Swiss National Science Foundation, NASA/STScI, and various national funding bodies across Europe, Asia, and Australia. No specific conflicts of interest were identified among the authors.
Publication Details
Title: The Local Distance Network: A community consensus report on the measurement of the Hubble constant at ∼1% precision | Authors: H0DN Collaboration, led by Stefano Casertano (Space Telescope Science Institute), with 36 co-authors from institutions including École Polytechnique Fédérale de Lausanne, Johns Hopkins University, NSF NOIRLab, European Southern Observatory, Max-Planck-Institute for Astrophysics, Harvard & Smithsonian Center for Astrophysics, Duke University, the University of Warsaw, and others across North America, Europe, Asia, and Australia. | Journal: Astronomy & Astrophysics, Volume 708, Article A166 (2026) | DOI: https://doi.org/10.1051/0004-6361/202557993 | Published online: April 10, 2026; Received November 5, 2025; Accepted December 2, 2025


