
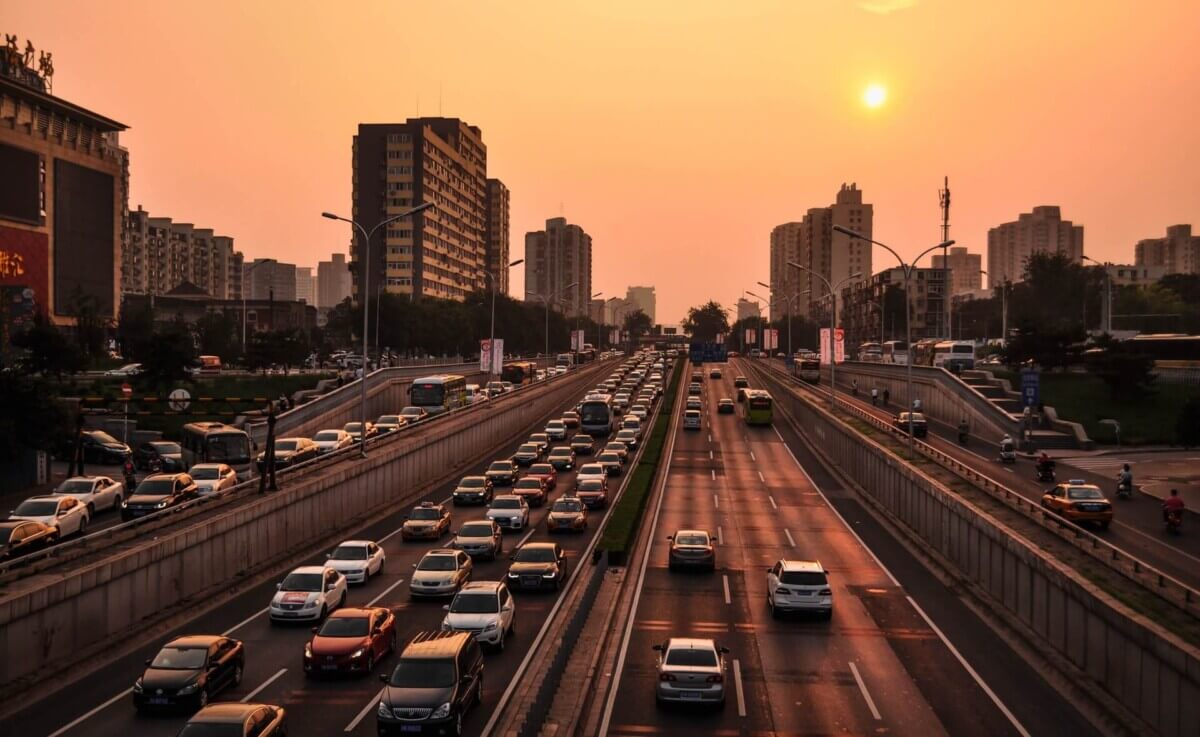
Photo by Ludovic Charlet on Unsplash
Not Speeding Could Save Americans $18 Million And 50,000 CO2 Tons Daily
In A Nutshell
- A new national analysis of more than 120 million vehicle trips estimates that speeding costs the country over $18 million and 50,000 metric tons of carbon dioxide pollution a day
- Sticking to posted speed limits would save an estimated 6 million-plus gallons of gasoline daily, yet only adds about 54 seconds to the average driver’s day
- More than 43% of trips included speeding, with rates varying sharply by state, vehicle type, and region
- Electric vehicles sped less often than gas-powered cars in California and had more to gain from slowing down
Nearly every driver has pushed past the speed limit at some point, probably due to a tight schedule or frustrating commute. These momentary lapses in best driving judgment rarely feel like major transgressions in the moment. However, a new analysis of more than 120 million vehicle trips finds this widespread habit could be costing the country more than $18 million and 50,000 metric tons of carbon dioxide pollution daily, while saving individual drivers an average of just 54 seconds.
Published in the journal Communications Sustainability, the research is one of the most detailed looks at speeding ever conducted at a national scale. Researchers at the University of Minnesota Twin Cities used GPS data from more than 120 million trips by gas-powered vehicles nationwide, plus electric vehicles in California, across four days in 2021, to model how much fuel, money, and clean air Americans could save by giving up the rush to arrive fractionally sooner.
Based on that modeling, more than 6 million gallons of gasoline would go unburned every day if drivers stuck to posted limits, drivers and businesses would keep more than $18 million, and the atmosphere would be spared tens of thousands of metric tons of heat-trapping gas. Scaled to a year, the researchers estimate those savings would equal permanently removing about 5.5 million passenger vehicles from American roads.
Who’s Speeding, and Where
Researchers Bharat Jayaprakash and William F. Northrop analyzed trips from four days in 2021, one per season, all Wednesdays, to avoid weekend or holiday traffic quirks. Speeding meant any moment a driver’s speed tipped above the posted limit on a highway or major road with a limit of at least 45 mph. More than 43% of trips included at least one speeding event, exceeding the limit by an average maximum of 11.2 mph and spending about 11.75% of drive time above it.
Speeding’s geography revealed sharp regional divides. In North Carolina, more than 62% of trips included a speeding event, while in one stretch of northeastern Nevada, drivers averaged more than 25 mph over the posted limit, the most extreme speeding found anywhere in the study. Fuel savings rose closely with how widespread speeding was in an area, but the authors caution the pattern also reflects where highways and major roads sit, not just driver behavior; a follow-up check found road network density explained much of the state-by-state variation.
Speeding habits also varied by vehicle type, with two-seaters averaging more than 15 mph over the limit while small SUVs and small pickup trucks stayed under 11 mph.
The Modeled Cost: Fuel, Money, and Pollution
To estimate what would happen if speeders eased off the gas, the team ran two scenarios: one capping speeds at the posted limit, another adding smoother, gradual slowing rather than cruising fast and braking hard. Using models calibrated to real-world fuel economy ratings, researchers calculated energy use for both versions of each trip, then scaled results to the national fleet using federal travel data. Strict compliance would translate to roughly 6.7 million gallons of gasoline saved per day, about $22 million in daily fuel costs, and around 57,000 metric tons of carbon dioxide, according to the model. The smoother scenario pushed those numbers higher, to about 8.2 million gallons and $27 million daily.
Electric vehicles were also modeled, but only in California, the only state with a large enough EV share for reliable data, reflecting just two EV models. EV drivers turned out to speed less often than gas-powered drivers, about 37% of trips versus 43.5% in the same state, and they had more to gain from slowing down: EVs showed proportional savings above 9% in some estimates, compared with roughly 2.4% to 3% for gas vehicles.
The 54-Second Tradeoff
This study’s most pointed finding may be its simplest: the time penalty for following the speed limit is nearly negligible. Researchers calculated that strict compliance would add about 54 seconds per day for a typical driver, or roughly 6 minutes a week, an average rather than a guaranteed delay on any single trip. California EV drivers faced an even smaller penalty, about 35 seconds a day. The researchers also flag costs beyond fuel and emissions: in 2023, 11,775 people died in U.S. crashes where speeding was a factor, federal data cited in the paper shows. The authors stop short of claiming eliminating speeding would prevent all such deaths, but argue even modest reductions could produce real safety benefits. They also note their model doesn’t capture how traffic flow might shift if nearly every driver slowed at once, an open question left for future research.
“Our results reinforce the notion that the ‘speeding to save time’ paradigm is largely illusory and offers no meaningful benefit to everyday drivers,” the authors write. Millions of gallons of fuel, tens of millions of dollars, and tens of thousands of metric tons of pollution are on the line, all chasing under a minute.
Disclaimer: This article summarizes findings from a peer-reviewed study and is intended for general informational purposes. It does not constitute driving, legal, or safety advice.
Paper Notes
Limitations
The study’s authors are transparent about several important constraints. The speeding analysis was limited to highways and major roads with posted speed limits of at least 45 mph, meaning true nationwide speeding rates are likely underestimated, and energy savings projections are conservative. The data covered only four days in 2021, all Wednesdays, a deliberate methodological choice, but one that does not capture the full range of weekly driving behavior; national data cited in the paper shows Wednesdays see lower average mileage than Thursdays or Fridays, so the estimates may not hold precisely for every day of the week. Two of the four days also fell during the COVID-19 recovery period, when national vehicle miles traveled remained below historical norms, which may affect how representative the extrapolated figures are for typical travel conditions. The electric vehicle analysis was limited to California and to just two electric vehicle production models, limiting how broadly those findings can be applied. The fuel and emissions savings estimates for gas-powered vehicles are based on tailpipe output and do not include the upstream pollution from extracting and refining oil, meaning the true emissions savings from slower driving could be even larger than reported. The study also does not account for how widespread speed compliance across an entire fleet might change traffic flow patterns at scale, which the authors identify as an open question for future research.
Funding and Disclosures
The paper states that the work was partially supported by the National Science Foundation under grant no. 1901099. The authors declare no competing interests. The primary driving dataset used in the study is proprietary and cannot be shared publicly due to privacy restrictions.
Publication Details
Authors: Bharat Jayaprakash and William F. Northrop, Department of Mechanical Engineering, University of Minnesota Twin Cities, Minneapolis, MN. | Paper Title: “Speeding incurs substantial environmental and economic costs nationwide for negligible travel time savings” | Journal: Communications Sustainability (a Nature Portfolio journal) | Published: 2026, Volume 1, Article 107 | DOI: https://doi.org/10.1038/s44458-026-00100-3


