(© Olga Mendenhall - stock.adobe.com)
Study Maps Racial Disparities In Fatal Police Shootings Across The USA.
In A Nutshell
- Black Americans are fatally shot by police at higher rates than White Americans in every single U.S. state, though the size of that gap varies dramatically by location.
- A Black resident in Oklahoma faces a fatal police shooting rate nearly six times higher than a Black resident in New York.
- Higher gun ownership rates are linked to more police shootings overall, but do not explain why racial disparities are larger in some states than others.
- Three Southwestern states, California, Arizona, and New Mexico, are largely responsible for driving the national Hispanic-White disparity in fatal police shootings.
No matter where a Black American lives, the data tells the same story. In all 50 states, Black residents are fatally shot by police at higher rates than White residents. Not in most states. Not only in states with the worst records on racial justice. Every single one. That finding is at the core of a new study from RAND Corporation researchers, and it arrives with a notable caveat: the size of that risk is depends enormously on where someone calls home.
Nationally, Black Americans are killed by police at roughly two and a half times the rate of White Americans. A Black resident in Oklahoma faces a fatal police shooting rate nearly six times that of a Black resident in New York. In Utah, the gap between Black and White shooting rates ranks among the largest in the country. In Mississippi, the absolute gap is among the smallest, though still present, and still tilted in the same direction.
Researchers published their analysis in PLOS One after examining nearly 6,000 fatal police shootings between 2015 and 2020 across all 50 states. What emerged reframes a central part of the national conversation. The question is no longer whether racial disparities in fatal police shootings exist, but why they are so much larger in some places than others.
How Fatal Police Shooting Rates Differ by State and Race
The RAND team drew on data from the Washington Post’s Fatal Force database, which compiles fatal police shootings from media reports, police records, and independent verification. Researchers calculated shooting rates per 100,000 residents for Black, White, and Hispanic Americans in each state, then applied statistical modeling to estimate both the rates and the racial gaps at the state level.
Over the six-year study period, Black Americans were fatally shot at a rate of 3.54 per 100,000, compared to 1.40 per 100,000 for White Americans. Black rates varied more than sixfold across states, from a low of 1.75 per 100,000 in New York to a high of 10.47 per 100,000 in Oklahoma. Western states tended to record the highest shooting rates overall, Northeastern states the lowest, and Southern states generally fell in the middle.
How the Black-White gap is measured also changes the picture. Southern states including Mississippi, Alabama, and South Carolina showed comparatively small absolute differences between Black and White rates. Northeastern states such as New York, Massachusetts, and Rhode Island had small absolute differences but very large proportional gaps, because White rates there are so low that even a modest Black rate produces a wide ratio. Western states, including Utah, Colorado, and California, showed large gaps on both measures.

Why Hispanic Fatal Police Shooting Rates Are a Southwest Story
One of the more unexpected patterns involves Hispanic Americans. Nationally, Hispanic residents are fatally shot at higher rates than White residents. Yet in 31 out of 50 states, the reverse is true.
A handful of Southwestern states explain the disconnect. New Mexico, California, Arizona, Colorado, and Washington show the largest gaps where Hispanic rates exceed White rates, and those states also have large Hispanic populations, giving them disproportionate influence on the national average. Remove California, Arizona, and New Mexico from the calculation, and the national Hispanic rate shifts from 24% above the White rate to 7% below it. As the researchers noted, “Southwestern states with large Hispanic-White disparities, relatively high shooting rates, and large Hispanic populations contribute most to the observed national disparity.”
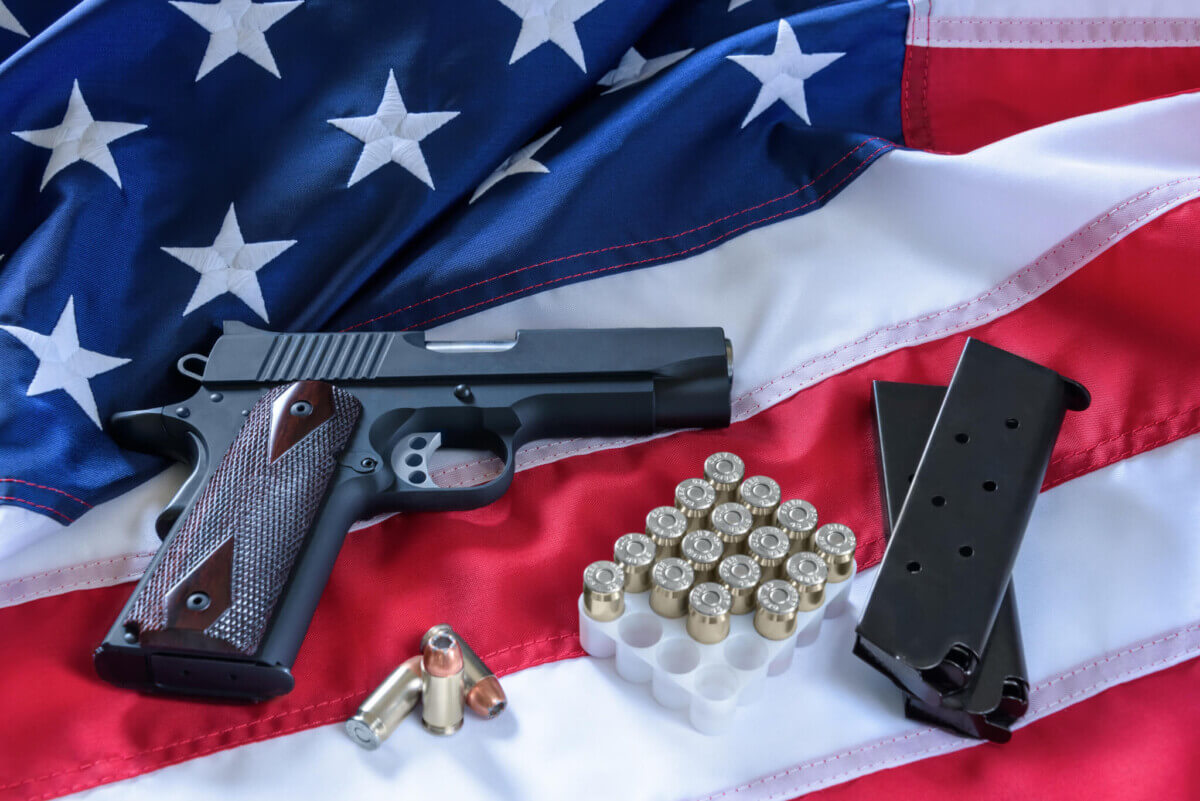
More Guns Mean More Fatal Police Shootings, but Not a Wider Racial Gap
States with higher rates of gun ownership also tend to have higher rates of fatal police shootings across all racial groups, a pattern researchers attributed in part to officers perceiving greater danger in environments where firearms are more common. That heightened perception can increase the likelihood of deadly force even in encounters where a civilian turns out to be unarmed.
But when researchers asked whether gun ownership levels explain why racial disparities are larger in some states than others, the answer was no. Black-White rate differences were relatively stable regardless of how many households in a state owned firearms. On a proportional basis, Black-White disparities were actually larger in states with the lowest gun ownership rates, because White rates fall sharply in those states while Black rates remain comparatively elevated. Reducing firearm availability could potentially lower the total number of people killed across all racial groups, though the study cannot determine whether that relationship is causal.
“Counterintuitively, policies that leave common metrics of racial or ethnic disparities unchanged, or even exacerbate them, may be effective solutions in reducing the harms faced by racialized minority groups,” the authors wrote. It is also worth noting that because Black individuals have a lower case fatality rate than White individuals when shot by police, the true racial gap across all police shooting encounters is likely even wider than what fatal-only data can show.
What the State-by-State Pattern Means for Reducing Racial Disparities in Police Shootings
“Ultimately, our results point to state differences as an underappreciated dimension of racial/ethnic disparities in police shootings, one that may point towards effective policy solutions to address such disparities,” the authors concluded.
A Black resident of Oklahoma and a Black resident of New York are subject to the same universal disparity, but they are living inside very different versions of it. Closing that gap requires understanding what makes certain states outliers, and the answer, this research makes clear, is not simply how many guns are in circulation. Researchers note that factors like policing practices, residential segregation, and socioeconomic differences could contribute to state-level variation in these patterns, though this study does not test those explanations directly.
Disclaimer: This article is based on an observational study and does not establish causal relationships. The findings reflect statistical associations and should not be interpreted as definitive explanations for racial disparities in fatal police shootings.
Paper Notes
Limitations
The study covers only fatal police shootings, not the roughly equal number of non-fatal police shootings that occur each year. Because Black individuals have a lower case fatality rate than White individuals when shot by police, the racial disparities across all police shooting encounters are likely larger than those reported here. The analysis is observational and associational rather than causal, meaning unmeasured factors such as poverty, residential segregation, policing practices, or access to trauma care could account for some of the patterns observed. Firearm ownership data were available only through 2018. Racial and ethnic data were missing for roughly 8% of fatalities and were excluded from the main analysis. Estimates were limited to Black, White, and Hispanic groups, as data on other racial and ethnic groups were insufficient for reliable state-level modeling.
Funding and Disclosures
Funding was provided by the Robert Wood Johnson Foundation (Grant #80257), with Andrew R. Morral and Rosanna Smart serving as principal investigators. The foundation played no role in the research process. Authors declared no competing interests.
Publication Details
“Racial and ethnic disparities in fatal police shootings: Variation across U.S. states and the role of firearm ownership” was authored by Roland Neil, Shawn Bushway, Terry L. Schell, Andrew R. Morral, and Rosanna Smart, all affiliated with RAND Corporation, Santa Monica, California; Shawn Bushway also holds an appointment at the Department of Public Administration and Policy, University at Albany, SUNY. Published March 11, 2026, in PLOS One, Vol. 21, Issue 3, article e0333424. DOI: https://doi.org/10.1371/journal.pone.0333424


A “rate” means divided by something. I believe these rates are number-of-shootings-by-police divided by population-size.
But shootings by police are not administered as a tax that applies to the population overall. The intention of police is to shoot only individuals who police need to shoot to protect themselves. Adding people who do not threaten or attack police wouldn’t increase the number of police shootings.
So the only _RELEVANT_ rate would be number-of-shootings-by-police divided by number-of-people-who-try-or-threaten-to-kill-police. A black Harvard professor recently published a study that showed no significant difference by race.
Why is this study (and its report) wasting our time on irrelevant statistics? For rabble-rousing propaganda, perhaps?
Gosh. I wonder…
Could it possibly be because Black individuals are disproportionately represented in arrests for homicide (51%) and robbery (52%) relative to their population.