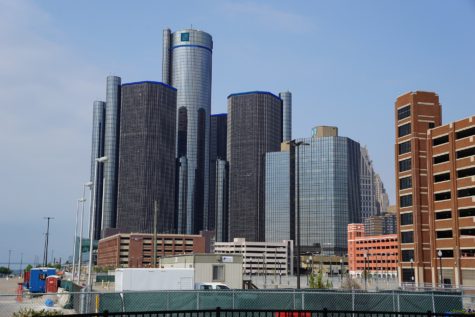
WASHINGTON — Detroit has been touted as being “America’s Comeback City” by some since declaring bankruptcy in 2013, but a 2017 study does The Motor City no favors in its revitalization efforts. According to WalletHub, Detroit is the unhealthiest city in America, as opposed to San Francisco, which got the top grade in a study of the country’s 150 most populated cities.
To reach their findings, WalletHub graded each city using 34 categories as metrics along with a specific weight for each category. The categories were split among four groups that accounted for 25 points each: health care, food, fitness, and green space. The higher the score, the healthier the city.
Categories considered in the study included mental health counselors per capita, cost of medical visit, and quality of public hospitals for health care; healthy restaurants per capita, share of obese residents, and produce consumption for categories under food; fitness clubs per capita, weight loss centers per capital, and share of residents who engage in any physical activity for categories in fitness; and quality of parks, bike score, and walking trails per capita among the categories for green space.
The top five healthiest cities in America were (1-5): San Francisco, Calif.; Salt Lake City, Utah; Scottsdale, Ariz.; Seattle, Wash.; Portland, Ore.
The unhealthiest cities were (146-150): Shreveport, La.; Laredo, TX; Memphis, Tenn.; Brownsville, TX; Detroit, Mich.
The full list from WalletHub.com:
| Overall Rank | City | Total Score | ‘Health Care’ Rank | ‘Food’ Rank | ‘Fitness’ Rank | ‘Green Space’ Rank |
|---|---|---|---|---|---|---|
| 1 | San Francisco, CA | 68.06 | 29 | 1 | 37 | 3 |
| 2 | Salt Lake City, UT | 67.50 | 27 | 3 | 3 | 17 |
| 3 | Scottsdale, AZ | 67.14 | 20 | 16 | 1 | 15 |
| 4 | Seattle, WA | 67.08 | 31 | 4 | 7 | 6 |
| 5 | Portland, OR | 65.16 | 49 | 2 | 18 | 10 |
| 6 | Irvine, CA | 63.96 | 5 | 11 | 12 | 14 |
| 7 | Huntington Beach, CA | 63.23 | 12 | 10 | 13 | 16 |
| 8 | Honolulu, HI | 62.67 | 8 | 5 | 53 | 11 |
| 9 | Washington, DC | 60.24 | 13 | 9 | 73 | 9 |
| 10 | Santa Clarita, CA | 59.67 | 10 | 38 | 44 | 1 |
| 11 | Tempe, AZ | 58.92 | 48 | 15 | 5 | 49 |
| 12 | Fort Lauderdale, FL | 58.87 | 45 | 17 | 14 | 21 |
| 13 | Fremont, CA | 58.82 | 21 | 14 | 35 | 18 |
| 14 | Boise, ID | 58.36 | 18 | 47 | 23 | 12 |
| 15 | Minneapolis, MN | 58.19 | 6 | 22 | 63 | 13 |
| 16 | Rancho Cucamonga, CA | 57.72 | 76 | 77 | 6 | 4 |
| 17 | Denver, CO | 57.65 | 38 | 13 | 22 | 27 |
| 18 | Lincoln, NE | 57.03 | 3 | 51 | 40 | 20 |
| 19 | Madison, WI | 56.99 | 16 | 33 | 38 | 19 |
| 20 | Orlando, FL | 56.44 | 94 | 8 | 19 | 55 |
| 21 | Atlanta, GA | 56.42 | 110 | 30 | 2 | 46 |
| 22 | Glendale, CA | 56.26 | 40 | 39 | 49 | 2 |
| 23 | Santa Rosa, CA | 56.25 | 92 | 20 | 50 | 5 |
| 24 | Plano, TX | 55.96 | 9 | 37 | 24 | 42 |
| 25 | Overland Park, KS | 55.76 | 1 | 88 | 16 | 95 |
| 26 | Vancouver, WA | 55.54 | 80 | 34 | 4 | 73 |
| 27 | Tampa, FL | 55.50 | 62 | 35 | 10 | 45 |
| 28 | Sacramento, CA | 54.66 | 67 | 12 | 66 | 22 |
| 29 | San Diego, CA | 54.61 | 53 | 23 | 41 | 25 |
| 30 | Oakland, CA | 54.41 | 82 | 6 | 81 | 39 |
| 31 | Boston, MA | 54.06 | 33 | 28 | 51 | 31 |
| 32 | Austin, TX | 53.82 | 30 | 21 | 56 | 33 |
| 33 | San Jose, CA | 53.78 | 4 | 18 | 75 | 64 |
| 34 | Richmond, VA | 53.56 | 52 | 41 | 28 | 43 |
| 35 | Raleigh, NC | 53.55 | 11 | 44 | 15 | 84 |
| 36 | Peoria, AZ | 53.46 | 64 | 106 | 25 | 7 |
| 37 | Reno, NV | 53.17 | 113 | 19 | 29 | 36 |
| 38 | St. Louis, MO | 53.02 | 108 | 49 | 20 | 28 |
| 39 | Tallahassee, FL | 53.01 | 56 | 119 | 34 | 8 |
| 40 | Sioux Falls, SD | 52.76 | 2 | 120 | 21 | 93 |
| 41 | Springfield, MO | 52.56 | 15 | 123 | 26 | 37 |
| 42 | Miami, FL | 52.46 | 105 | 7 | 84 | 51 |
| 43 | Virginia Beach, VA | 52.28 | 24 | 66 | 45 | 35 |
| 44 | Pittsburgh, PA | 51.71 | 23 | 45 | 33 | 72 |
| 45 | Spokane, WA | 51.64 | 78 | 48 | 47 | 29 |
| 46 | St. Paul, MN | 51.50 | 19 | 60 | 61 | 38 |
| 47 | Gilbert, AZ | 51.44 | 22 | 75 | 8 | 80 |
| 48 | Chandler, AZ | 51.27 | 32 | 63 | 11 | 100 |
| 49 | Garden Grove, CA | 51.23 | 36 | 25 | 88 | 67 |
| 50 | Long Beach, CA | 51.07 | 51 | 24 | 80 | 40 |
| 51 | Pembroke Pines, FL | 50.56 | 25 | 71 | 27 | 123 |
| 52 | Rochester, NY | 50.40 | 107 | 29 | 72 | 30 |
| 53 | Durham, NC | 50.32 | 58 | 58 | 36 | 62 |
| 54 | Cincinnati, OH | 50.28 | 119 | 26 | 31 | 68 |
| 55 | Colorado Springs, CO | 50.14 | 28 | 82 | 57 | 44 |
| 56 | Chesapeake, VA | 50.08 | 35 | 98 | 68 | 23 |
| 57 | Worcester, MA | 49.73 | 68 | 68 | 39 | 70 |
| 58 | St. Petersburg, FL | 49.72 | 66 | 65 | 30 | 66 |
| 59 | Anaheim, CA | 49.69 | 41 | 27 | 71 | 76 |
| 60 | Aurora, CO | 49.63 | 34 | 52 | 60 | 65 |
| 61 | Las Vegas, NV | 49.23 | 135 | 43 | 9 | 90 |
| 62 | Oceanside, CA | 49.13 | 73 | 93 | 32 | 83 |
| 63 | Grand Rapids, MI | 49.10 | 14 | 59 | 97 | 56 |
| 64 | Henderson, NV | 49.05 | 101 | 118 | 17 | 48 |
| 65 | Tacoma, WA | 48.96 | 109 | 54 | 42 | 77 |
| 66 | Albuquerque, NM | 48.52 | 42 | 56 | 69 | 58 |
| 67 | Buffalo, NY | 48.25 | 77 | 40 | 77 | 58 |
| 68 | Anchorage, AK | 47.82 | 100 | 55 | 99 | 26 |
| 69 | Yonkers, NY | 47.52 | 37 | 57 | 104 | 53 |
| 70 | Omaha, NE | 47.06 | 17 | 89 | 67 | 92 |
| 71 | Glendale, AZ | 46.79 | 79 | 87 | 86 | 41 |
| 72 | Knoxville, TN | 46.40 | 128 | 86 | 64 | 34 |
| 73 | Little Rock, AR | 46.23 | 57 | 122 | 52 | 63 |
| 74 | Modesto, CA | 46.20 | 122 | 104 | 54 | 50 |
| 75 | Los Angeles, CA | 45.95 | 70 | 32 | 109 | 78 |
| 76 | Des Moines, IA | 45.76 | 7 | 114 | 92 | 98 |
| 77 | Mesa, AZ | 45.66 | 71 | 78 | 46 | 112 |
| 78 | Providence, RI | 45.58 | 134 | 74 | 78 | 32 |
| 79 | Chicago, IL | 44.78 | 60 | 69 | 130 | 47 |
| 80 | Tucson, AZ | 44.68 | 121 | 70 | 65 | 81 |
| 81 | Charlotte, NC | 44.30 | 46 | 109 | 55 | 119 |
| 82 | Norfolk, VA | 44.15 | 98 | 79 | 110 | 54 |
| 83 | Jersey City, NJ | 44.15 | 55 | 31 | 136 | 94 |
| 84 | Baltimore, MD | 44.01 | 125 | 53 | 120 | 52 |
| 85 | Phoenix, AZ | 44.00 | 96 | 85 | 91 | 75 |
| 86 | Port St. Lucie, FL | 43.97 | 91 | 131 | 48 | 125 |
| 87 | Newport News, VA | 43.77 | 75 | 90 | 103 | 87 |
| 88 | Huntsville, AL | 43.72 | 123 | 117 | 70 | 60 |
| 89 | Santa Ana, CA | 43.63 | 95 | 50 | 119 | 91 |
| 90 | Philadelphia, PA | 43.42 | 126 | 46 | 131 | 57 |
| 91 | New Orleans, LA | 43.13 | 146 | 121 | 87 | 24 |
| 92 | Aurora, IL | 43.10 | 44 | 94 | 124 | 88 |
| 93 | Irving, TX | 42.91 | 103 | 72 | 111 | 99 |
| 94 | Fontana, CA | 42.90 | 133 | 95 | 83 | 86 |
| 95 | Lexington-Fayette, KY | 42.75 | 26 | 113 | 98 | 108 |
| 96 | New York, NY | 42.65 | 85 | 36 | 146 | 61 |
| 97 | Riverside, CA | 42.50 | 124 | 76 | 74 | 104 |
| 98 | Garland, TX | 42.50 | 81 | 62 | 106 | 114 |
| 99 | Nashville, TN | 42.42 | 54 | 105 | 101 | 96 |
| 100 | Greensboro, NC | 42.39 | 72 | 132 | 85 | 71 |
| 101 | Fort Wayne, IN | 42.11 | 47 | 135 | 62 | 101 |
| 102 | Lubbock, TX | 42.06 | 63 | 130 | 58 | 113 |
| 103 | Chula Vista, CA | 41.88 | 65 | 110 | 90 | 116 |
| 104 | Milwaukee, WI | 41.65 | 61 | 81 | 138 | 85 |
| 105 | Oxnard, CA | 41.55 | 111 | 80 | 135 | 79 |
| 106 | Kansas City, MO | 41.52 | 39 | 108 | 113 | 106 |
| 107 | Ontario, CA | 41.36 | 136 | 64 | 128 | 110 |
| 108 | Akron, OH | 41.05 | 74 | 99 | 132 | 89 |
| 109 | Grand Prairie, TX | 40.50 | 90 | 83 | 144 | 105 |
| 110 | Arlington, TX | 40.26 | 86 | 97 | 100 | 129 |
| 111 | Dallas, TX | 39.95 | 104 | 67 | 118 | 134 |
| 112 | Jacksonville, FL | 39.84 | 129 | 101 | 96 | 117 |
| 113 | Cape Coral, FL | 39.69 | 118 | 136 | 76 | 109 |
| 114 | Columbus, OH | 39.66 | 83 | 107 | 116 | 118 |
| 115 | Louisville, KY | 39.22 | 115 | 96 | 112 | 121 |
| 116 | Wichita, KS | 39.11 | 59 | 129 | 82 | 131 |
| 117 | Fayetteville, NC | 39.10 | 120 | 145 | 59 | 140 |
| 118 | Moreno Valley, CA | 39.03 | 137 | 100 | 142 | 74 |
| 119 | Birmingham, AL | 38.89 | 141 | 102 | 95 | 130 |
| 120 | Stockton, CA | 38.41 | 112 | 73 | 127 | 126 |
| 121 | Houston, TX | 38.37 | 87 | 103 | 114 | 138 |
| 122 | Cleveland, OH | 38.27 | 139 | 61 | 141 | 103 |
| 123 | Amarillo, TX | 38.15 | 88 | 138 | 121 | 82 |
| 124 | Fort Worth, TX | 37.88 | 106 | 91 | 108 | 146 |
| 125 | Winston-Salem, NC | 37.72 | 99 | 144 | 122 | 97 |
| 126 | Columbus, GA | 37.51 | 138 | 134 | 126 | 69 |
| 127 | Jackson, MS | 37.41 | 50 | 139 | 93 | 148 |
| 128 | San Antonio, TX | 37.34 | 84 | 112 | 115 | 142 |
| 129 | Montgomery, AL | 37.08 | 131 | 141 | 89 | 128 |
| 130 | Tulsa, OK | 36.97 | 89 | 125 | 102 | 136 |
| 131 | Fresno, CA | 36.92 | 132 | 111 | 123 | 122 |
| 132 | Chattanooga, TN | 36.91 | 144 | 147 | 79 | 102 |
| 133 | Hialeah, FL | 36.88 | 102 | 42 | 150 | 141 |
| 134 | Indianapolis, IN | 36.85 | 93 | 115 | 125 | 135 |
| 135 | San Bernardino, CA | 36.60 | 147 | 92 | 134 | 115 |
| 136 | Bakersfield, CA | 36.40 | 127 | 116 | 105 | 139 |
| 137 | Oklahoma City, OK | 35.78 | 69 | 126 | 129 | 137 |
| 138 | Mobile, AL | 35.61 | 149 | 148 | 43 | 149 |
| 139 | El Paso, TX | 35.29 | 116 | 137 | 117 | 124 |
| 140 | Baton Rouge, LA | 35.18 | 145 | 140 | 94 | 107 |
| 141 | Augusta, GA | 34.32 | 140 | 124 | 107 | 150 |
| 142 | Toledo, OH | 33.92 | 97 | 127 | 139 | 143 |
| 143 | Newark, NJ | 33.28 | 143 | 84 | 147 | 133 |
| 144 | North Las Vegas, NV | 32.69 | 142 | 133 | 145 | 111 |
| 145 | Corpus Christi, TX | 32.56 | 130 | 143 | 133 | 132 |
| 146 | Shreveport, LA | 32.44 | 114 | 149 | 137 | 147 |
| 147 | Laredo, TX | 30.65 | 43 | 146 | 149 | 127 |
| 148 | Memphis, TN | 29.77 | 150 | 128 | 140 | 144 |
| 149 | Brownsville, TX | 28.54 | 117 | 150 | 143 | 145 |
| 150 | Detroit, MI | 28.37 | 148 | 142 | 148 | 120 |
The WalletHub.com list also included a breakdown of best and worst cities for several of the categories, including the cities with the highest and lowest costs of medical care, highest and lowest premature death rates, and highest and lowest costs of memberships to fitness centers. They also break down the weighted values per category to fully explain their methodology.


San Francisco — A crime-ridden bumfest with skyrocketing rents, illegals, drugs and urine-soaked streets.
all those mental health counselors in san francisco and yet the thousands of deranged mental cases still walk the streets urinating where they will and doing their drugs also at will and in public. What a joke of a study! Was the metric which included the mentally deranged and snowflakes deliberately overlooked so as to guarantee frisco the 1st place?
“Categories considered in the study included mental health counselors per capita…”
San Fran? Let’s see here. 5 for every resident?
That would be, an underestimate, for those whiney, diaper wearing, freaks.
And yes, you can see them, on every street corner.
LOL, obviously they have never been to SF. Apparently somehow, the authors do not relate cleanliness to health.
My only problem with this survey is the points awarded for “green” spaces. That one is the only reason SF is above SLC when SLC clearly has better healthy outcomes. What good is rating how many green spaces you have if your fitness score is 37th.
Woopie we have green spaces, which apparently few are utilizing. It would be like rating a city based on how much exercise equipment was bought last year, not actual time spent exercising. Yes their can be a correlation, but it can’t be assumed. This is similar to the WHO ranking on healthcare including as a heavily weighted metric: Distribution of care. So a country with shitty outcomes is ranked higher than one without universal healthcare, because even though the outcomes are worse and the quality is worse, at least everyone has access to the shitty care…
Looks like racial demographics plays a major part in this list’s rankings. Racist list?
the deep south?….Land of the fatties…and Gop governors
WE’RE NUMBER ONE!!!!!
Glad we won something.
Congrats to the city to my south.
Well done Detroit!
San Francisco is a disgusting city.
What a total load of BS this list is. San Fran, Portland, Seattle? Yeah, talk about shooting your credibility in the arse at first glance…………….
Pissing in the streets and craping on sidewalks is very healthy.
LMAO so obviously flawed and biased.
BS Greenspace metric.
And food metric is really subjective.
YHGTBSM….. What a bullsh*$ study and waste of time….
They forgot to throw in the radiation levels from Fukishima in the San Fran data.
Might change the rating
“Gym memberships” may be higher in those cities, but that does not, I know this for a fact, translate into “gym use.”
Left out “most piles of human excrement per sq. ft.” as one of the parameters. SF runaway winner
“Food” and “GreenSpace” appear to be weighted disproportionately; one’s access to “fitness” and “health care” should be more important, unless you think a person is not chiefly responsible for his/her own health.