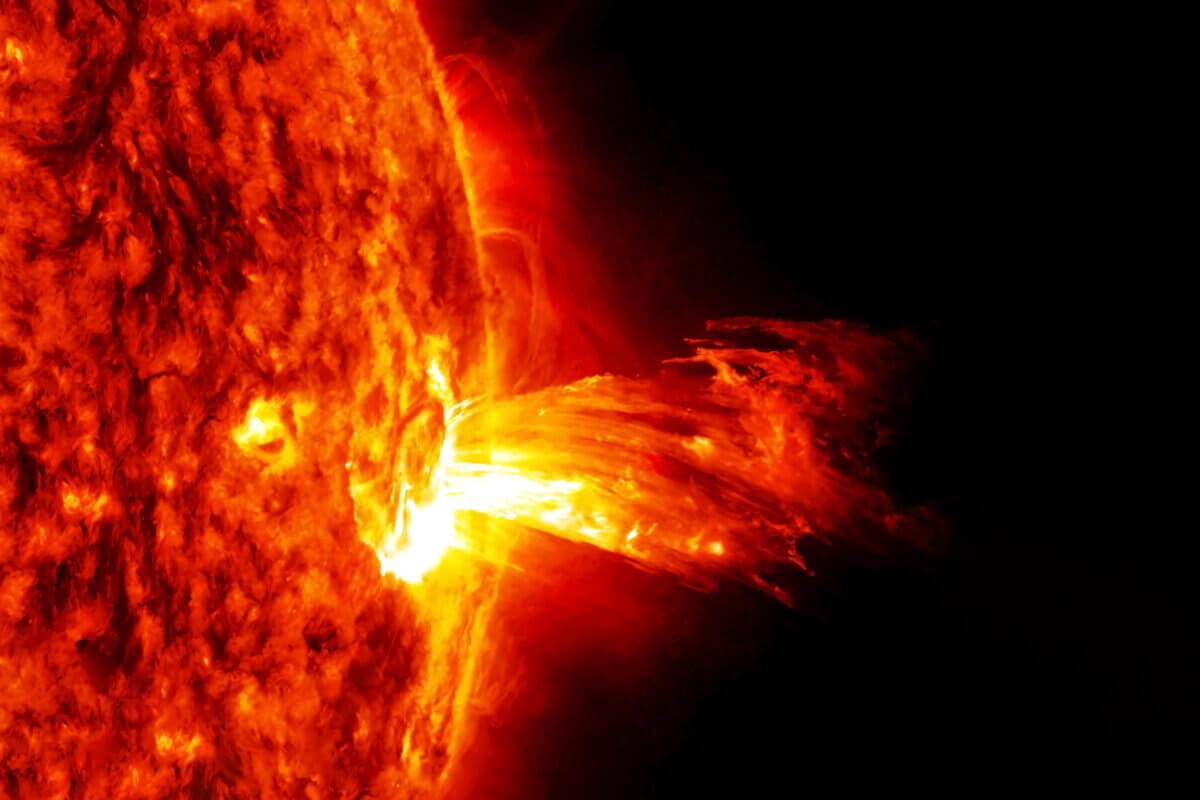
Depiction of a solar storm erupting from Sun's surface. Elements of this image furnished by NASA.(Image by Artsiom P on Shutterstock)
How Eight Solar Eruptions Merged Into Earth’s Worst Geomagnetic Storm in 20 Years
In A Nutshell
- Ten solar eruptions launched in rapid succession in May 2024, and eight of them merged into three combined structures on the way to Earth, producing the strongest geomagnetic storm in roughly twenty years.
- Researchers built one of the most detailed simulations yet attempted of the event, modeling all ten eruptions individually to see exactly how each one shaped the storm.
- The best simulation predicted the storm’s arrival within about two hours and its peak strength within about 70 percent of what was actually observed.
- Real-time forecasters had far less data than this study used after the fact, a gap the researchers say is urgent to close before the next major storm.
On Mother’s Day weekend 2024, the sun let loose a barrage unlike anything Earth had seen in two decades. Ten eruptions of magnetized plasma blasted off in rapid succession, several catching up to and merging in space, before arriving at Earth as a tangled, amplified disturbance that triggered the strongest geomagnetic storm in roughly twenty years, with a peak intensity reading around negative 420 nanoteslas, a standard measure of geomagnetic disturbance. Scientists were left asking a hard question: how did ten separate solar eruptions link up in a way that made the whole event so much worse than any one of them alone?
Now they have a detailed answer. Researchers publishing in The Astrophysical Journal built one of the most detailed simulations yet attempted of the event, tracking all ten eruptions through space to reconstruct how several merged and reshaped one another on the way in.
Eight of the Ten Eruptions Merged Into Three Combined Structures
At least ten eruptions left the sun between May 8 and 11, 2024, most from a single hyperactive sunspot region, NOAA AR 13664, with additional contributions from neighboring active regions. Earlier modeling of these kinds of events had tackled two or three colliding eruptions at most; this study modeled all ten, adding each one individually to reveal exactly which eruption contributed what to the overall storm. Researchers from the University of Iowa, KU Leuven, and the Indian Institute of Technology Roorkee drew on data from multiple spacecraft that recorded the speed, magnetic properties, and direction of each eruption, then fed that data into a physics-based forecasting tool simulating how solar plasma travels through the inner solar system, letting the team watch digitally as the ten eruptions interacted.
Researchers linked the ten eruptions to five distinct disturbances, called ejecta, detected near Earth. Several were produced by eruptions that merged along the way: the first three fused early in their journey, a fourth accelerated into that group and amplified the disturbance further, and two more pairs merged into a second and third structure. The final two, however, arrived largely on their own, producing the fourth and fifth disturbances individually. These sequences come from simulation results rather than direct observation, and the researchers note that input uncertainty limits confidence in the finer details.

Faster Eruptions Caught and Compressed the Slower Ones Ahead of Them
One central finding is that the storm’s violence did not simply come from unusually fast or large individual eruptions; interactions between them mattered just as much. That amplification effect has been documented in smaller events before, but this storm gave researchers an unusually complicated case. Three eruptions had not been counted in earlier analyses, and adding them let the simulation reproduce higher-speed solar wind readings after the main peak that earlier models had failed to explain.
Its best-performing run reproduced the storm’s arrival time within about two hours and estimated its peak strength at about 70 percent of what was actually observed. That gap reflects a persistent problem in solar science: measuring an eruption accurately while it is still close to the sun is extremely difficult, especially when it appears to expand outward in all directions from Earth’s point of view, a geometry that makes true speed and shape hard to pin down from any single instrument.
Speed Inputs Alone Shifted the Storm’s Predicted Arrival by Nine Hours
Researchers ran the simulation four different ways, using speed measurements from three different methods and instruments. The predicted arrival time of the first shock wave shifted by as much as nine hours depending on which inputs were used, showing how sensitive forecasting is to measurement quality.
Choices inside the simulation also shaped what it could reproduce. Its eruption model represents each eruption as a simplified magnetic structure, practical for real-time forecasting but unable to fully capture the complexity of the real thing, so some finer magnetic field details near Earth went unmatched. Sharpening the resolution captured more detail but slightly overestimated some arrival speeds, and the model still struggled with the crowded zones where trailing eruptions pushed into the plasma clouds ahead of them, detail beyond what this simulation can currently handle.
Real Forecasters Would Have Had Far Less Data Than This Study Did
Forecasters working in real time during the Mother’s Day event had access to only a fraction of the data the research team used afterward, running the simulation repeatedly and refining inputs against what instruments recorded. A real forecaster gets one shot, and that gap between research-grade analysis and operational forecasting is one the authors flag as urgently worth closing.
Multiple eruptions in short succession are not unusual during solar maximum, the peak of the sun’s activity cycle, when eruption rates can exceed ten per day. A storm this severe remains rare; it was, after all, the strongest in two decades. Better observatories and faster simulation tools could help close the two-hour gap between simulated and real-world timing, giving grid operators and satellite managers a genuine head start the next time solar eruptions chain together toward Earth.
Disclaimer: This article is based on findings published in a peer-reviewed journal and is intended for general informational purposes. It is not a substitute for official space weather alerts or guidance from government and scientific agencies.
Paper Notes
Limitations
The authors identify several important limitations in their work. The largest source of error was uncertainty in the input parameters used to describe each solar eruption, particularly because many of the ten eruptions appeared as halo or partial-halo events in the observations, making their true geometry, direction, and speed difficult to measure accurately from any single viewpoint. The eruption model used in the simulation, while practical for operational forecasting, uses a simplified magnetic structure that does not fully capture the internal complexity of real eruptions, leading to mismatches in some magnetic field components. The simulation also used a steady-state representation of the solar wind rather than a dynamically evolving one, which may have caused it to miss some time-varying features in the solar wind observations. Small-scale physical processes such as magnetic reconnection within the turbulent regions between the plasma wave arrivals are also outside the scope of this type of physics simulation. Finally, the resolution of the simulation, while improved during this study by doubling the number of radial calculation points and halving the angular spacing, still introduces trade-offs between accuracy in magnetic field prediction and accuracy in arrival speed prediction.
Funding and Disclosures
According to the acknowledgments section of the paper, authors A. Maharana and S. Poedts are funded by the European Union, though the authors note that the views expressed are their own and do not necessarily reflect those of the European Union or its research funding agency. S. Poedts’ project, identified as Open SESAME, received funding under the Horizon Europe program with ERC Advanced Grant agreement number 101141362. Additional support is acknowledged from C1 project Internal Funds KU Leuven (C16/24/010), FWO-Vlaanderen grants G0B5823N and G002523N, and ESA Prodex project 4000145223 (SIDC Data Exploitation, SIDEX2). Computational infrastructure was provided by the VSC, the Flemish Supercomputer Center, funded by the Hercules Foundation and the Flemish Government.
Publication Details
Authors: Shirsh Lata Soni, Anwesha Maharana, Sanchita Pal, and Stefaan Poedts | Title: Comprehensive Magnetohydrodynamic Modeling of 10 Successive Coronal Mass Ejections Driving a Historic Geomagnetic Storm, the 2024 Mother’s Day Event | Journal: The Astrophysical Journal, Volume 1007, Article 72 (17 pp.), 2026 August 10; published online August 7, 2026 | DOI: 10.3847/1538-4357/ae825e


