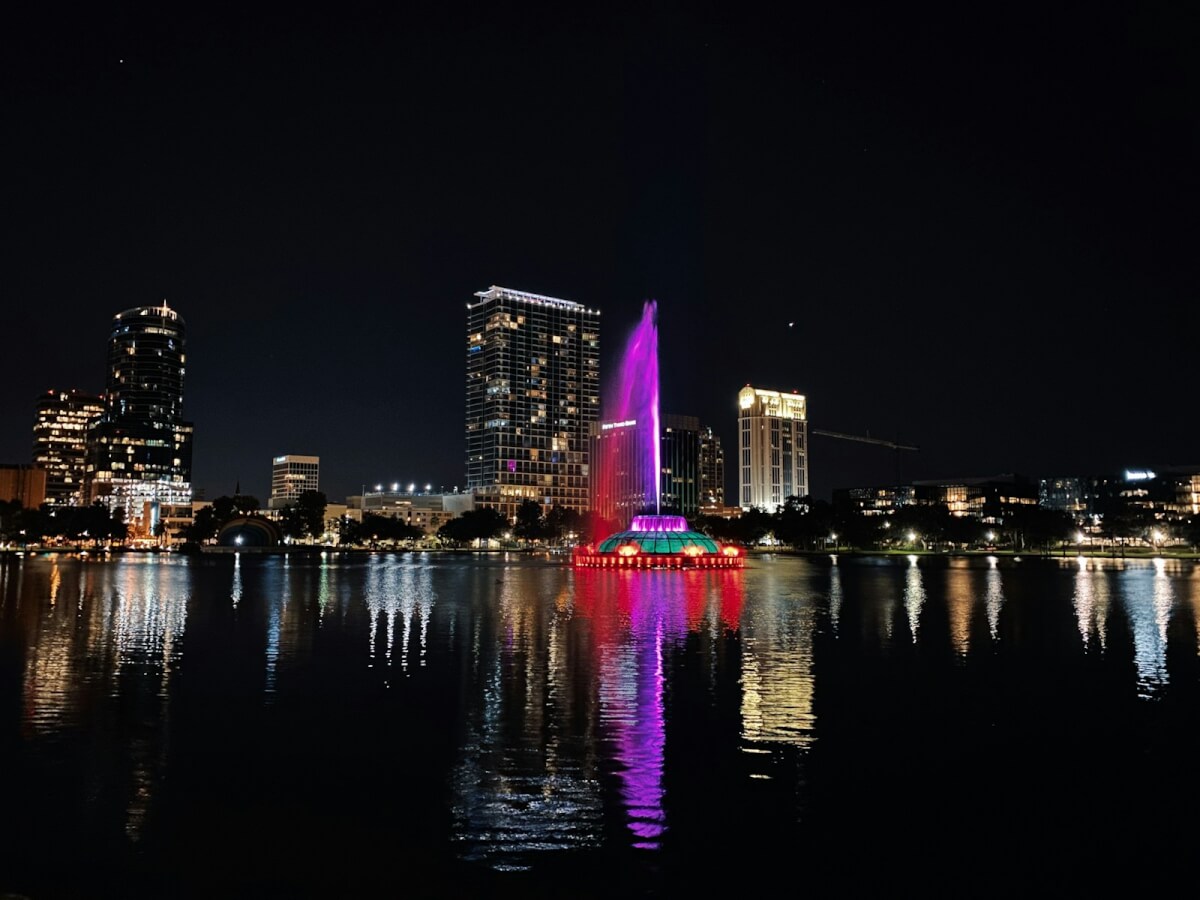
Orlando, Florida (Photo by Talia on Unsplash)
In A Nutshell
- Orlando, Florida ranked as the best place to retire among 182 U.S. cities, scoring 63.38 out of 100, with Miami (59.40) and Tampa (59.29) close behind for an all-Florida top three.
- Stockton, California finished last at 35.19, dragged down by a 182nd-place finish for retiree activities, the worst in the study.
- California claimed six of the ten lowest-scoring cities; Florida placed nine cities in the top 40.
Retirement used to come with a simple promise: work hard for four decades, then coast. That promise is looking shakier. Only 21% of American workers say they are very confident they will have enough money to retire comfortably, according to figures cited in a new WalletHub report, and nearly three-quarters expect to keep working in some capacity even after they officially retire.
Where a person settles can make that math a lot easier, or a lot harder. WalletHub graded 182 U.S. cities on how friendly each one is to retirees, scoring them across 45 measures covering cost, taxes, things to do, safety and medical care. Orlando, Florida, finished first with a score of 63.38 out of 100. Stockton, California, finished 182nd with 35.19, a gap of 28 points between the top and bottom of the ranking.
Florida owns the top tier outright. Orlando, Miami and Tampa swept the first three spots, and nine Florida cities landed in the top 40. California went the other direction, claiming six of the ten worst-scoring cities for retirees, including the bottom two.

Florida Sweeps the Best Places to Retire
Ten cities anchored the top of the ranking: Orlando (63.38), Miami (59.40), Tampa (59.29), Scottsdale, Arizona (58.87), Casper, Wyoming (58.79), Atlanta (58.73), Minneapolis (57.92), Fort Lauderdale (57.92), Charleston, South Carolina (57.54) and Pittsburgh (56.58).
No single trait explains all ten. Casper ranked third in affordability but only 63rd for activities. Minneapolis came 97th in affordability and eighth for things to do. Scottsdale placed first in the country for quality of life while sitting at 114th on cost. High finishers tended to be lopsided, strong enough in two or three categories to carry a weak spot.
Taxes gave the Florida cities a major advantage. Chip Lupo, a WalletHub analyst quoted in the report, put the calculation plainly: “It’s important to choose wisely when picking where to retire, as many retirees are on a fixed income. As a result, the best cities for retired people are those that minimize taxes and expenses, as well as have good opportunities for retirees to continue paid work for extra income, if they choose to do so.”
Jonathon Ferguson, a financial capability specialist at the University of Wisconsin-Madison who contributed to the report’s expert panel, pointed to the same lever. “State rules regarding taxation of pension benefits, social security benefits, long term capital gains, etc. can vary a lot,” he wrote. He stopped short of calling taxes the deciding factor, adding that “choosing the most tax-efficient location during retirement should not be the guiding factor, in my opinion, it should be heavily considered.”
Inside the Top Three Best Places to Retire
Orlando earned its first-place finish mostly on money and free time. Florida charges no income tax, no estate tax and no inheritance tax, and Orlando ranks as one of the most tax-friendly cities in the study. Its broader cost of living is unremarkable, but two expenses that hit older adults hardest come in cheap: it is the 15th-cheapest city for homemaker services and 20th-cheapest for adult day health care out of the more than 180 cities measured. On the activities side, Orlando placed second nationally for recreation overall, with an especially high concentration of music venues, fishing facilities, art galleries and volunteer opportunities for adults. Medical care held up too. Orlando ranks 21st for gerontologists, eighth for home health care facilities per capita, and fourth for hospitals specializing in geriatrics.
Miami took second on the strength of its calendar. It ranks at the top of the country for adult volunteer activities, art galleries and fishing facilities per capita, plus 17th for museums and 11th for recreation and senior centers. Florida’s tax rules apply here as well, and Miami sits among the cheapest cities in the study on taxes generally. One more advantage matters for anyone who eventually stops driving: Miami is the sixth-most walkable city in the country, and the vast majority of residents live within walking distance of quality public transportation. WalletHub credits that abundance of activities as the main reason Miami placed second, even with an affordability rank of 54th.
Tampa, third overall, leaned on tax friendliness, safety and social life. Like its Florida neighbors it has no estate or inheritance tax, and it carries the 19th-lowest property crime rate in the study. Tampa also ranked fifth nationally for recreation, ninth for bingo halls per capita and 11th for adult volunteer activities. Its weak spot is medical care, where it placed 89th, the softest health care showing of any city in the top five.

Stockton Lands at the Bottom
Stockton, California, closed the ranking at 182nd. Its score of 35.19 sat more than a full point below the next-worst city and 28.19 points behind Orlando.
Boredom, in statistical terms, was Stockton’s biggest problem. It finished 182nd out of 182 for activities, a category that counts recreation and senior centers, museums, theaters, art galleries, music venues, public golf courses, fishing facilities, book clubs, bingo halls and adult volunteer opportunities, most of them measured against population size. Nothing else in its scorecard rescued it. Stockton placed 153rd for health care, 135th for affordability and 133rd for quality of life, so a retiree there faces middling costs without the medical infrastructure or amenities that justify them.
Nine other cities rounded out the bottom ten: San Bernardino, California (36.83), Newark, New Jersey (37.89), Fresno, California (38.30), Rancho Cucamonga, California (38.48), Bakersfield, California (38.70), Tacoma, Washington (39.02), Bridgeport, Connecticut (39.14), Detroit (39.46) and Fontana, California (39.85).
California’s presence at the bottom traces largely to cost. San Bernardino, Fresno and Bakersfield all posted poor marks across multiple categories, and expensive coastal metros fared badly on price even when they scored well elsewhere: San Francisco ranked first in the country for activities yet 172nd for affordability, landing at 21st overall. New York City finished 142nd overall on the back of a 182nd-place affordability rank, dead last in the study.
Scoring 182 Cities Across 45 Metrics
WalletHub built the ranking from the 150 most populated U.S. cities plus at least two of the most populated cities in each state, using city limits only and excluding surrounding suburbs. Analysts scored each city on 45 metrics, graded each metric on a 100-point scale where 100 marks the most favorable conditions, then took a weighted average to produce the total score.
Four categories carried 25 points apiece, an even split of the 100 available. Within each category, individual metrics were assigned full, half, double or triple weight depending on how much they matter to a retiree’s daily life.
Affordability leaned hard on one number. Adjusted cost of living got triple weight, about 10 of the category’s 25 points, on the assumption that retirees live on fixed incomes and lower expenses translate directly into a better outcome. Three tax measures followed at roughly 3.33 points each: general taxpayer-friendliness, taxation of retirement income and property, and whether the state levies an estate or inheritance tax. Annual cost of adult day health care carried full weight, and the annual cost of in-home services carried half.

Activities spread its 25 points across 11 measures at roughly 2.38 points each, counting recreation and senior centers, fishing facilities, public golf courses, museums, theaters, art galleries, music venues, bingo halls, adult volunteer availability and overall recreation-friendliness, with book clubs at half weight. Most of these are measured per capita using the square root of population, a technique that keeps small cities from being flattered by minor differences in headcount.
Quality of life divided its points among 14 measures, with mild weather double-weighted at about 3.33 points. Everything else, including walkability, transit access for residents aged 65 to 79, violent and property crime rates, air and water quality, the share of seniors living in poverty or living alone, elder-abuse protections and AARP age-friendly designation, counted at roughly 1.67 points each.
Health care split its 25 points across 14 measures at about 1.85 points each, including family physicians and gerontologists per capita, nurses, physical therapists, home-care facilities, top-rated geriatrics hospitals, life expectancy and the elderly death rate. Dentists per capita counted at half weight. Data were collected as of August 3, 2026 from sources including the Census Bureau, the FBI, the Bureau of Labor Statistics, the CDC, the Centers for Medicare & Medicaid Services and AARP.
One caution belongs alongside these numbers. A city-level ranking averages conditions across an entire municipality, which means a well-situated neighborhood in a low-ranked city can beat a poorly situated one in a high-ranked city. Ferguson’s advice to the report’s readers cut in a similar direction, warning against building a retirement around spreadsheets alone: “money is just a tool to help people live the lives that bring them joy. For this reason, the money plan should follow the life plan.”
A 28-point spread between Orlando and Stockton is not a rounding error. WalletHub scored these cities on the assumption that retirees rely on a fixed income, where lower expenses count as the better outcome, and its four categories, cost, activities, quality of life and medical care, separate the top of the list from the bottom by a wide margin. Choosing a city is one of the few retirement decisions that moves all four at once.
| Rank | City | Score | Affordability | Activities | Quality of Life | Health Care |
|---|---|---|---|---|---|---|
| 1 | Orlando, FL | 63.38 | 2 | 17 | 77 | 11 |
| 2 | Miami, FL | 59.40 | 54 | 6 | 91 | 29 |
| 3 | Tampa, FL | 59.29 | 41 | 10 | 34 | 89 |
| 4 | Scottsdale, AZ | 58.87 | 114 | 18 | 1 | 35 |
| 5 | Casper, WY | 58.79 | 3 | 63 | 23 | 65 |
| 6 | Atlanta, GA | 58.73 | 56 | 4 | 96 | 52 |
| 7 | Minneapolis, MN | 57.92 | 97 | 8 | 89 | 20 |
| 8 | Fort Lauderdale, FL | 57.92 | 75 | 13 | 64 | 41 |
| 9 | Charleston, SC | 57.54 | 29 | 26 | 79 | 59 |
| 10 | Pittsburgh, PA | 56.58 | 112 | 21 | 57 | 7 |
| 11 | Madison, WI | 56.52 | 110 | 49 | 6 | 19 |
| 12 | Las Vegas, NV | 56.49 | 11 | 5 | 97 | 169 |
| 13 | Cape Coral, FL | 56.25 | 14 | 72 | 26 | 82 |
| 14 | Wilmington, DE | 56.18 | 71 | 23 | 153 | 15 |
| 15 | Cincinnati, OH | 56.18 | 107 | 2 | 101 | 62 |
| 16 | St. Petersburg, FL | 55.94 | 41 | 32 | 36 | 88 |
| 17 | Tempe, AZ | 55.40 | 114 | 47 | 14 | 30 |
| 18 | Sioux Falls, SD | 55.33 | 28 | 141 | 65 | 1 |
| 19 | Denver, CO | 55.24 | 94 | 11 | 82 | 70 |
| 20 | Richmond, VA | 55.09 | 53 | 34 | 127 | 22 |
| 21 | San Francisco, CA | 54.73 | 172 | 1 | 22 | 39 |
| 22 | Pembroke Pines, FL | 54.65 | 68 | 102 | 16 | 80 |
| 23 | Austin, TX | 54.56 | 45 | 29 | 71 | 114 |
| 24 | Bismarck, ND | 54.35 | 79 | 155 | 28 | 6 |
| 25 | Columbia, MD | 54.21 | 130 | 78 | 5 | 8 |
See the full ranking: cities 26 through 182
| Rank | City | Score | Affordability | Activities | Quality of Life | Health Care |
|---|---|---|---|---|---|---|
| 26 | St. Louis, MO | 53.92 | 40 | 20 | 176 | 28 |
| 27 | Boise, ID | 53.86 | 82 | 64 | 13 | 74 |
| 28 | Knoxville, TN | 53.42 | 4 | 77 | 131 | 119 |
| 29 | Columbia, SC | 53.00 | 17 | 81 | 81 | 94 |
| 30 | Portland, ME | 52.89 | 134 | 22 | 47 | 32 |
| 31 | Hialeah, FL | 52.49 | 54 | 108 | 27 | 76 |
| 32 | San Diego, CA | 52.48 | 158 | 12 | 15 | 44 |
| 33 | Fargo, ND | 52.27 | 43 | 174 | 110 | 4 |
| 34 | Charleston, WV | 52.09 | 23 | 67 | 75 | 144 |
| 35 | Nashua, NH | 51.99 | 89 | 99 | 86 | 27 |
| 36 | Salt Lake City, UT | 51.93 | 99 | 16 | 155 | 86 |
| 37 | Jacksonville, FL | 51.90 | 9 | 66 | 114 | 116 |
| 38 | St. Paul, MN | 51.85 | 102 | 40 | 63 | 63 |
| 39 | Los Angeles, CA | 51.81 | 160 | 15 | 19 | 48 |
| 40 | West Valley City, UT | 51.77 | 96 | 82 | 61 | 91 |
| 41 | Virginia Beach, VA | 51.68 | 57 | 93 | 48 | 57 |
| 42 | Akron, OH | 51.33 | 64 | 61 | 85 | 111 |
| 43 | New Orleans, LA | 51.28 | 111 | 7 | 173 | 67 |
| 44 | Juneau, AK | 51.20 | 105 | 51 | 138 | 18 |
| 45 | Colorado Springs, CO | 51.10 | 47 | 96 | 35 | 97 |
| 46 | Washington, DC | 51.01 | 143 | 3 | 78 | 103 |
| 47 | San Antonio, TX | 50.90 | 39 | 28 | 137 | 163 |
| 48 | Cedar Rapids, IA | 50.89 | 44 | 154 | 43 | 107 |
| 49 | Chandler, AZ | 50.77 | 114 | 97 | 4 | 77 |
| 50 | Dallas, TX | 50.56 | 69 | 39 | 119 | 130 |
| 51 | Raleigh, NC | 50.47 | 70 | 74 | 106 | 55 |
| 52 | Chattanooga, TN | 50.42 | 7 | 128 | 147 | 126 |
| 53 | Henderson, NV | 50.38 | 11 | 112 | 10 | 174 |
| 54 | Rapid City, SD | 50.34 | 86 | 116 | 171 | 5 |
| 55 | Tucson, AZ | 50.21 | 78 | 35 | 70 | 162 |
| 56 | Tallahassee, FL | 50.20 | 8 | 123 | 88 | 146 |
| 57 | Des Moines, IA | 50.14 | 18 | 143 | 84 | 102 |
| 58 | Reno, NV | 49.98 | 33 | 70 | 44 | 170 |
| 59 | Glendale, CA | 49.75 | 163 | 60 | 8 | 13 |
| 60 | Philadelphia, PA | 49.72 | 123 | 33 | 109 | 56 |
| 61 | Honolulu, HI | 49.61 | 179 | 9 | 3 | 66 |
| 62 | Louisville, KY | 49.60 | 92 | 48 | 76 | 129 |
| 63 | Overland Park, KS | 49.54 | 125 | 125 | 46 | 34 |
| 64 | Jackson, MS | 49.45 | 22 | 85 | 164 | 132 |
| 65 | Manchester, NH | 49.34 | 90 | 156 | 40 | 37 |
| 66 | Birmingham, AL | 49.29 | 26 | 38 | 177 | 131 |
| 67 | Huntington Beach, CA | 49.18 | 163 | 25 | 38 | 31 |
| 68 | Portland, OR | 49.16 | 137 | 14 | 117 | 104 |
| 69 | Irvine, CA | 49.10 | 163 | 41 | 24 | 17 |
| 70 | Missoula, MT | 49.06 | 132 | 50 | 163 | 3 |
| 71 | Long Beach, CA | 49.05 | 160 | 31 | 30 | 41 |
| 72 | Lexington-Fayette, KY | 49.03 | 93 | 145 | 17 | 45 |
| 73 | Milwaukee, WI | 49.01 | 91 | 44 | 169 | 49 |
| 74 | Norfolk, VA | 49.00 | 57 | 80 | 102 | 109 |
| 75 | Plano, TX | 48.98 | 85 | 120 | 33 | 78 |
| 76 | Phoenix, AZ | 48.95 | 114 | 45 | 68 | 113 |
| 77 | Columbus, OH | 48.92 | 100 | 101 | 41 | 72 |
| 78 | Fort Worth, TX | 48.82 | 63 | 75 | 56 | 152 |
| 79 | Mobile, AL | 48.77 | 31 | 90 | 124 | 155 |
| 80 | Durham, NC | 48.62 | 80 | 121 | 139 | 16 |
| 81 | Cheyenne, WY | 48.51 | 25 | 149 | 52 | 147 |
| 82 | Houston, TX | 48.46 | 35 | 43 | 167 | 158 |
| 83 | Anchorage, AK | 48.46 | 87 | 92 | 113 | 51 |
| 84 | North Las Vegas, NV | 48.44 | 11 | 130 | 67 | 166 |
| 85 | Grand Rapids, MI | 48.39 | 129 | 56 | 100 | 50 |
| 86 | Huntington, WV | 48.34 | 16 | 166 | 135 | 154 |
| 87 | Brownsville, TX | 48.30 | 1 | 178 | 95 | 167 |
| 88 | Baton Rouge, LA | 48.20 | 65 | 46 | 170 | 138 |
| 89 | Little Rock, AR | 48.11 | 67 | 129 | 161 | 61 |
| 90 | Peoria, AZ | 48.09 | 114 | 87 | 39 | 128 |
| 91 | Grand Prairie, TX | 47.98 | 72 | 151 | 49 | 123 |
| 92 | Nampa, ID | 47.94 | 82 | 167 | 25 | 140 |
| 93 | Chesapeake, VA | 47.73 | 57 | 164 | 42 | 100 |
| 94 | Gilbert, AZ | 47.69 | 114 | 119 | 20 | 108 |
| 95 | Port St. Lucie, FL | 47.68 | 37 | 161 | 92 | 106 |
| 96 | Kansas City, MO | 47.67 | 51 | 71 | 162 | 95 |
| 97 | Chicago, IL | 47.46 | 148 | 19 | 116 | 84 |
| 98 | Boston, MA | 47.45 | 181 | 30 | 32 | 9 |
| 99 | Nashville, TN | 47.45 | 50 | 57 | 180 | 93 |
| 100 | Glendale, AZ | 47.44 | 114 | 73 | 74 | 98 |
| 101 | Garland, TX | 47.39 | 72 | 127 | 55 | 143 |
| 102 | Cleveland, OH | 47.37 | 88 | 55 | 165 | 90 |
| 103 | Garden Grove, CA | 47.35 | 163 | 62 | 31 | 21 |
| 104 | Albuquerque, NM | 47.35 | 84 | 53 | 136 | 145 |
| 105 | Sacramento, CA | 47.16 | 151 | 37 | 29 | 101 |
| 106 | Oklahoma City, OK | 46.97 | 34 | 88 | 130 | 160 |
| 107 | Irving, TX | 46.89 | 72 | 133 | 105 | 85 |
| 108 | Huntsville, AL | 46.85 | 38 | 159 | 73 | 159 |
| 109 | Oakland, CA | 46.81 | 146 | 36 | 115 | 46 |
| 110 | Tulsa, OK | 46.72 | 30 | 103 | 145 | 148 |
| 111 | Springfield, MO | 46.51 | 52 | 110 | 160 | 122 |
| 112 | Newport News, VA | 46.50 | 57 | 144 | 103 | 142 |
| 113 | Winston-Salem, NC | 46.47 | 27 | 153 | 107 | 135 |
| 114 | Aurora, CO | 46.46 | 94 | 138 | 129 | 23 |
| 115 | Fremont, CA | 46.24 | 171 | 105 | 2 | 40 |
| 116 | Dover, DE | 46.14 | 66 | 84 | 182 | 118 |
| 117 | Mesa, AZ | 46.14 | 114 | 111 | 45 | 124 |
| 118 | Santa Ana, CA | 46.04 | 163 | 59 | 53 | 25 |
| 119 | Fort Wayne, IN | 46.03 | 61 | 157 | 87 | 110 |
| 120 | Lewiston, ME | 45.98 | 103 | 142 | 72 | 92 |
| 121 | Oceanside, CA | 45.94 | 155 | 68 | 21 | 69 |
| 122 | Memphis, TN | 45.85 | 5 | 104 | 179 | 157 |
| 123 | El Paso, TX | 45.84 | 10 | 139 | 90 | 172 |
| 124 | Arlington, TX | 45.75 | 62 | 124 | 98 | 149 |
| 125 | Rochester, NY | 45.72 | 144 | 42 | 134 | 58 |
| 126 | Charlotte, NC | 45.53 | 81 | 117 | 122 | 112 |
| 127 | Omaha, NE | 45.46 | 128 | 100 | 120 | 33 |
| 128 | South Burlington, VT | 45.42 | 153 | 113 | 126 | 2 |
| 129 | Augusta, GA | 45.38 | 24 | 165 | 66 | 180 |
| 130 | Aurora, IL | 45.37 | 148 | 83 | 62 | 47 |
| 131 | Las Cruces, NM | 45.16 | 76 | 148 | 99 | 165 |
| 132 | Santa Clarita, CA | 44.95 | 162 | 106 | 18 | 54 |
| 133 | San Jose, CA | 44.84 | 170 | 126 | 9 | 26 |
| 134 | Corpus Christi, TX | 44.63 | 15 | 109 | 158 | 175 |
| 135 | Providence, RI | 44.61 | 141 | 58 | 118 | 87 |
| 136 | Billings, MT | 44.49 | 108 | 150 | 123 | 81 |
| 137 | Columbus, GA | 44.43 | 48 | 169 | 50 | 177 |
| 138 | Worcester, MA | 44.38 | 140 | 118 | 112 | 43 |
| 139 | Anaheim, CA | 44.25 | 163 | 79 | 58 | 24 |
| 140 | Laredo, TX | 44.18 | 6 | 179 | 104 | 181 |
| 141 | Buffalo, NY | 44.11 | 133 | 52 | 146 | 125 |
| 142 | New York, NY | 44.01 | 182 | 24 | 37 | 60 |
| 143 | Amarillo, TX | 43.79 | 21 | 177 | 121 | 176 |
| 144 | Santa Rosa, CA | 43.69 | 174 | 95 | 11 | 99 |
| 145 | Indianapolis, IN | 43.68 | 101 | 107 | 172 | 73 |
| 146 | Montgomery, AL | 43.58 | 20 | 146 | 152 | 179 |
| 147 | Lincoln, NE | 43.53 | 150 | 122 | 51 | 36 |
| 148 | Seattle, WA | 43.49 | 177 | 27 | 60 | 71 |
| 149 | Fayetteville, NC | 43.34 | 31 | 131 | 157 | 178 |
| 150 | Vancouver, WA | 43.21 | 147 | 91 | 142 | 53 |
| 151 | Modesto, CA | 43.18 | 98 | 181 | 69 | 156 |
| 152 | New Haven, CT | 43.11 | 152 | 136 | 149 | 10 |
| 153 | Toledo, OH | 43.11 | 109 | 135 | 140 | 105 |
| 154 | Burlington, VT | 43.08 | 153 | 76 | 144 | 38 |
| 155 | Lubbock, TX | 43.08 | 19 | 158 | 154 | 164 |
| 156 | Gulfport, MS | 43.07 | 36 | 89 | 174 | 182 |
| 157 | Yonkers, NY | 42.92 | 178 | 69 | 59 | 14 |
| 158 | Chula Vista, CA | 42.54 | 158 | 163 | 12 | 68 |
| 159 | Fort Smith, AR | 42.45 | 49 | 152 | 143 | 168 |
| 160 | Wichita, KS | 42.39 | 104 | 137 | 148 | 139 |
| 161 | Shreveport, LA | 42.34 | 77 | 168 | 151 | 150 |
| 162 | Baltimore, MD | 42.09 | 130 | 54 | 175 | 117 |
| 163 | Warwick, RI | 41.98 | 141 | 115 | 128 | 79 |
| 164 | Oxnard, CA | 41.88 | 157 | 132 | 54 | 75 |
| 165 | Greensboro, NC | 41.80 | 46 | 134 | 178 | 151 |
| 166 | Spokane, WA | 41.02 | 113 | 147 | 156 | 121 |
| 167 | Pearl City, HI | 41.02 | 179 | 175 | 7 | 96 |
| 168 | Jersey City, NJ | 40.99 | 173 | 98 | 80 | 64 |
| 169 | Ontario, CA | 40.67 | 145 | 160 | 108 | 115 |
| 170 | Moreno Valley, CA | 40.62 | 136 | 180 | 94 | 134 |
| 171 | Riverside, CA | 40.13 | 139 | 114 | 125 | 133 |
| 172 | Salem, OR | 40.02 | 124 | 173 | 132 | 141 |
| 173 | Fontana, CA | 39.85 | 138 | 170 | 93 | 136 |
| 174 | Detroit, MI | 39.46 | 127 | 94 | 181 | 137 |
| 175 | Bridgeport, CT | 39.14 | 176 | 162 | 159 | 12 |
| 176 | Tacoma, WA | 39.02 | 175 | 65 | 150 | 83 |
| 177 | Bakersfield, CA | 38.70 | 106 | 172 | 111 | 173 |
| 178 | Rancho Cucamonga, CA | 38.48 | 163 | 171 | 83 | 120 |
| 179 | Fresno, CA | 38.30 | 122 | 176 | 141 | 161 |
| 180 | Newark, NJ | 37.89 | 156 | 86 | 168 | 127 |
| 181 | San Bernardino, CA | 36.83 | 126 | 140 | 166 | 171 |
| 182 | Stockton, CA | 35.19 | 135 | 182 | 133 | 153 |
Category columns show each city’s relative rank out of 182, where 1 is the best conditions in that category. Green marks the 10 best cities for retirees, red the 10 worst. Source: Adam McCann, “Best & Worst Places to Retire (2026),” WalletHub.
Survey Methodology
WalletHub compared the retirement-friendliness of 182 cities: the 150 most populated U.S. cities plus at least two of the most populated cities in each state. Only the city proper was considered in each case, and cities in surrounding metro areas were excluded. Analysts evaluated four dimensions, Affordability, Activities, Quality of Life and Health Care, using 45 metrics. Each metric was graded on a 100-point scale, with 100 representing the most favorable conditions for retirement, and each city’s weighted average across all metrics produced its overall score. For per-capita metrics marked with an asterisk in the source, the square root of the population was used to avoid overcompensating for minor differences across cities; several tax and state-level metrics were available only at the state level. The analysis assumes retirees rely on a fixed income, meaning lower expenses score better.
Each of the four dimensions carried 25 points. Within Affordability, adjusted cost of living received triple weight (about 10 points), taxpayer-friendliness, retired taxpayer-friendliness, estate or inheritance tax friendliness and annual cost of adult day health care each received full weight (about 3.33 points), and annual cost of in-home services received half weight (about 1.67 points). Activities spread its points across 11 metrics at roughly 2.38 points each, with book clubs per capita at half weight. Quality of Life divided its points across 14 metrics at roughly 1.67 points each, with mild weather double-weighted at about 3.33 points. Health Care split its points across 14 metrics at about 1.85 points each, with dentists per capita at half weight.
Data were collected as of August 3, 2026 from the U.S. Census Bureau, Federal Bureau of Investigation, Council for Community and Economic Research, Bureau of Labor Statistics, U.S. Environmental Protection Agency, County Health Rankings, Centers for Disease Control and Prevention, The Kiplinger Washington Editors, Trust for Public Land, Centers for Medicare & Medicaid Services, GreatNonprofits, Transportation for America, U.S. News & World Report, Tax Foundation, Yelp, Walk Score, AARP, GolfLink, Genworth Financial, Meetup and WalletHub research.
Publication Details
Report: “Best & Worst Places to Retire (2026).” Author: Adam McCann, WalletHub Financial Writer. Published by WalletHub on August 31, 2026. Expert commentary quoted in this article comes from Chip Lupo, WalletHub Analyst, and Jonathon Ferguson, Financial Capability Specialist, University of Wisconsin-Madison Financial Education Division of Extension, both quoted within the report. The report includes an “Ask the Experts” panel and a full methodology section. No DOI applies, as this is a company-published ranking rather than a journal article.


